
Crypto Factor Model Analysis: Launching Stablecoins 1
An analysis of using stablecoin flows to predict L1 performance.

Main Takeaway: Stablecoin capital flows between chains predict cross-sectional L1 returns, delivering a 1.67 Sharpe over 5 years that is almost entirely independent of broad crypto market direction.
Executive Summary
We constructed a weekly-rebalanced long-short factor from tracking stablecoin flows.
The raw strategy delivers a 1.67 Sharpe and +83.6% annualized return over five years, with a -43.9% max drawdown. Adding a volatility-targeting risk overlay compresses the Sharpe to 1.17 but cuts the max drawdown to -31.9%.
The factor is effectively market-neutral and inversely correlated with down markets: market beta is -0.03 (not significant) with an R² of 0.1%. In BTC-negative months, the raw factor averaged +6.8% while BTC averaged -10.9%.
Annualized alpha is +73.8% for the raw factor after controlling for market exposure (t-stat 3.31, p = 0.001), statistically significant at the 1% level.
The factor is the least-correlated factor in our stack (max pairwise correlation 0.16) and retains significant alpha (t-stat 2.54) after controlling for all other factors simultaneously in a spanning regression.
The long leg generates 84% of returns. The factor is fundamentally a positive-flow detector for mid-cap L1s and L2s rather than a structural short on mega-caps. Five chains (Polygon, Mantle, Optimism, BSC, Sei) account for 84% of total returns.
Goal
Stablecoins 1 was created to test the theory that stablecoin flows can predict L1 performance. The core idea is that stablecoins moving onto a blockchain is a leading indicator that the chain’s native token is about to appreciate. For example, when dollars in the form of stablecoins (eg. USDC, USDT, etc.) flow onto Solana, it signals capital is arriving. That same capital will buy SOL, pay SOL gas fees, provide liquidity in SOL pools, and generally drive demand for the SOL token. On the other hand, when stablecoin supply is shrinking, capital is leaving, and the chain’s token will underform.
This thesis, if true, should produce returns that are independent of the broader crypto market because the factor trades on relative capital allocation between chains rather than market direction. We test this independence property below.
To learn more about our methodology, request detailed testing results, or explore commercial opportunities, please reach out to the Artemis team.
Process
Stablecoins 1 is a long-short factor using on-chain data to look at stablecoin and L1 data sourced from Artemis.
Every week, the strategy looks at all 18 chains (Ethereum, Solana, BNB, Arbitrum, etc.) and ranks them by signals that all measure stablecoin flow direction. The signals are then converted to a rank score to see how each chain stands relative to its peers, averaged into a composite score, and sorted into quintiles. The strategy longs the top quintile (about 3-4 chains with strongest inflows) and shorts the bottom (about 3-4 chains with the worst outflows), holding for one week, and then rebalances.
We also explored adding risk overlays to limit downside. Positions are scaled each week to target 20% annualized realized volatility with a leverage cap of 1.5x, and exposure is further reduced during deep drawdowns measured against a rolling peak. Using a rolling peak ensures that we can resume the full-size trading strategy after extended flat periods, avoiding permanent deleveraging after a deep drawdown. Unlike Fundamentals 1, there’s no BTC regime filter because the factor naturally backs off during down crypto markets as capital leaves, stablecoin supply contracts, and the strategy’s exposure shrinks.
Performance & Results
Backtested Performance
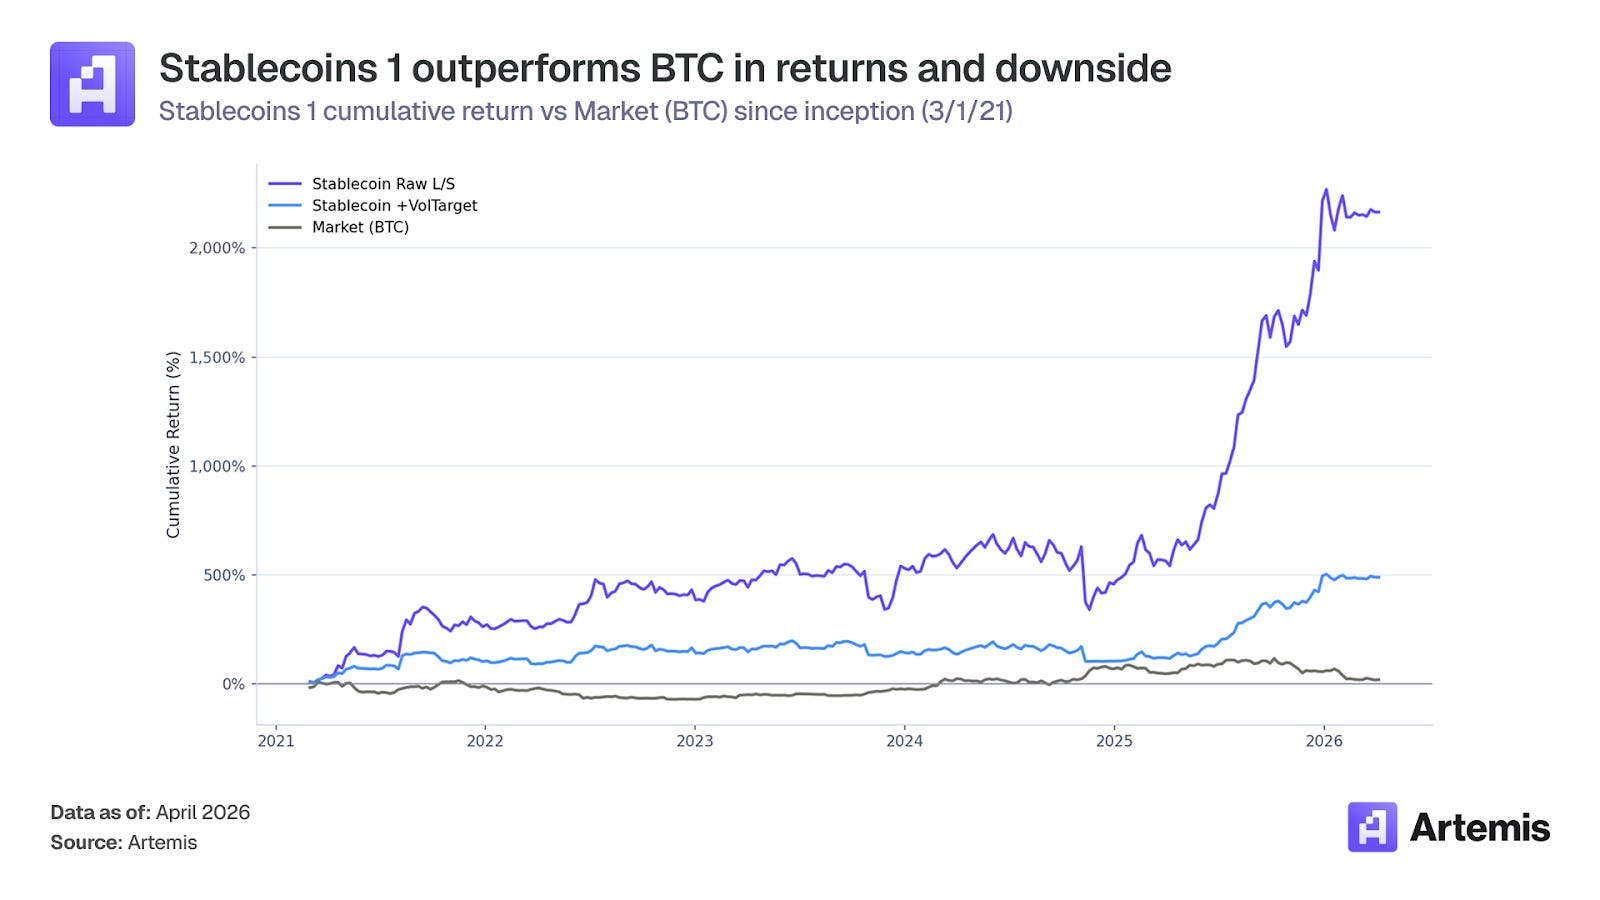
We look at the performance of Stablecoins 1 since its inception on March 1, 2021. We can compare looking at the raw factor without the risk overlay and the factor with volatility scaling.
Returns are gross of transaction costs as realized performance would depend on execution costs and liquidity at time of trade. However, we have found this strategy to be highly cost resilient. The breakeven transaction costs are estimated to be 197 bps per trade. This is a result of moderate weekly turnover (57.9%) and high liquidity of L1 tokens.
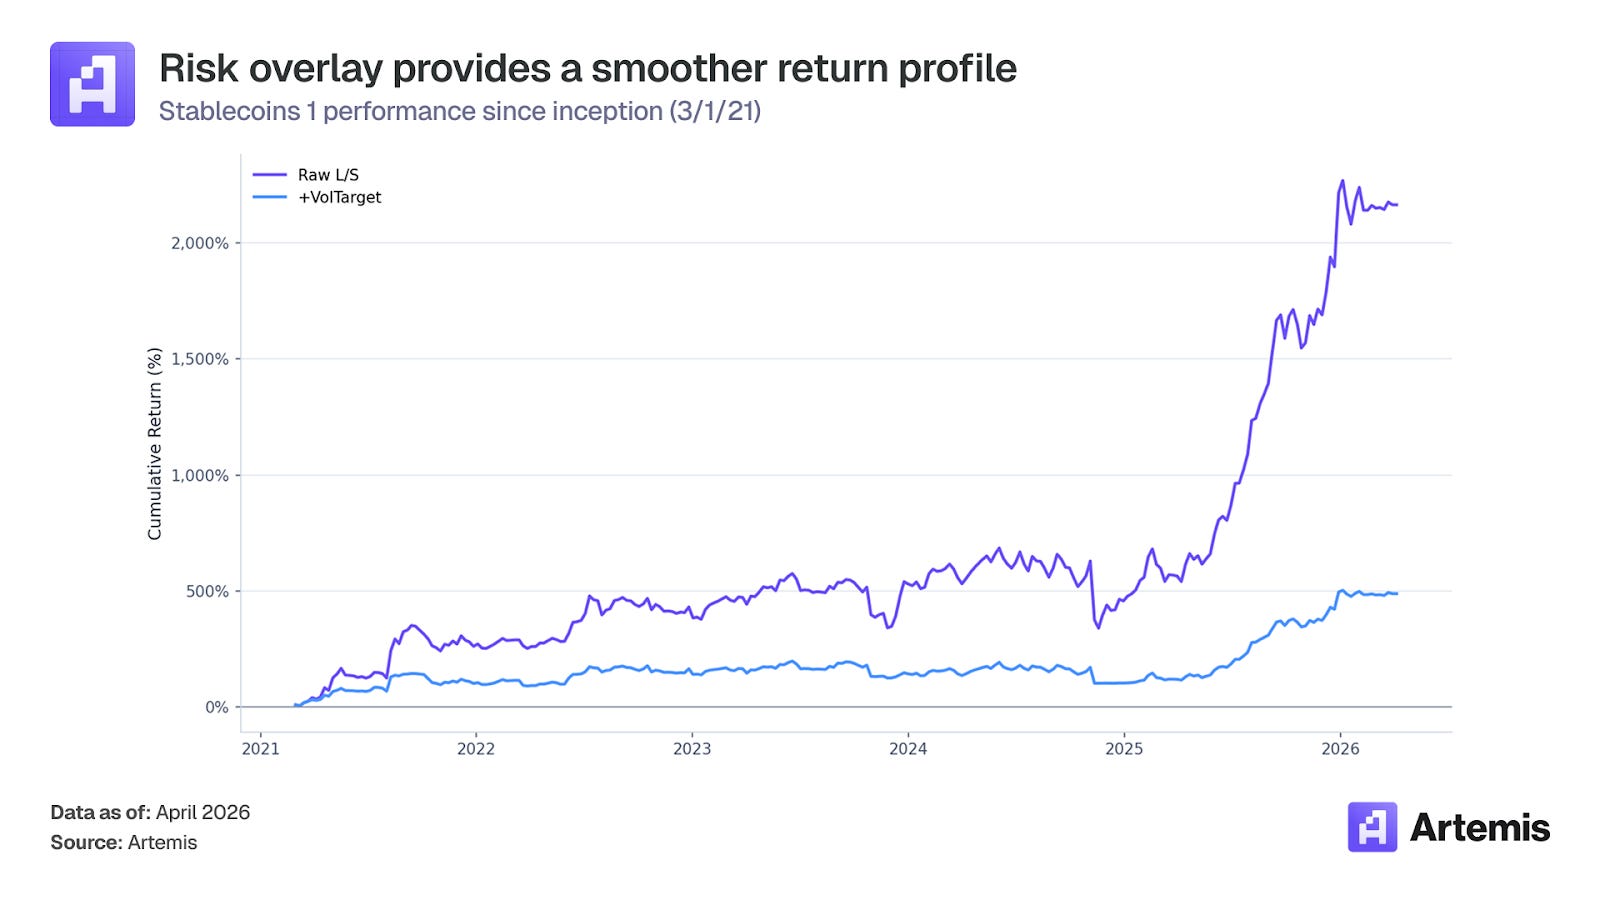
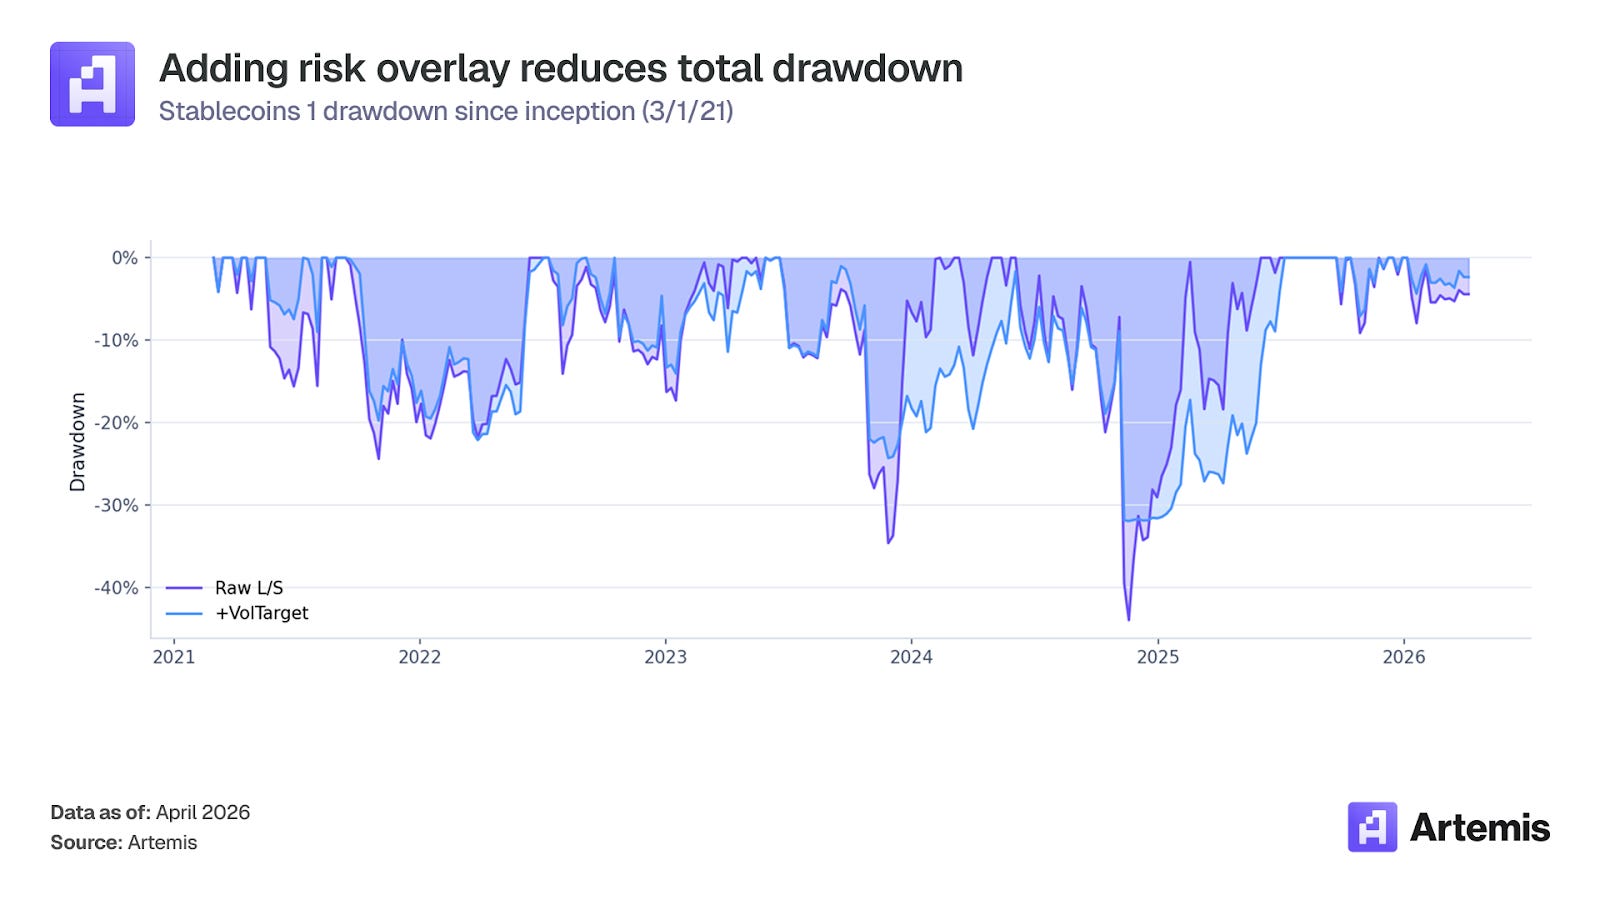
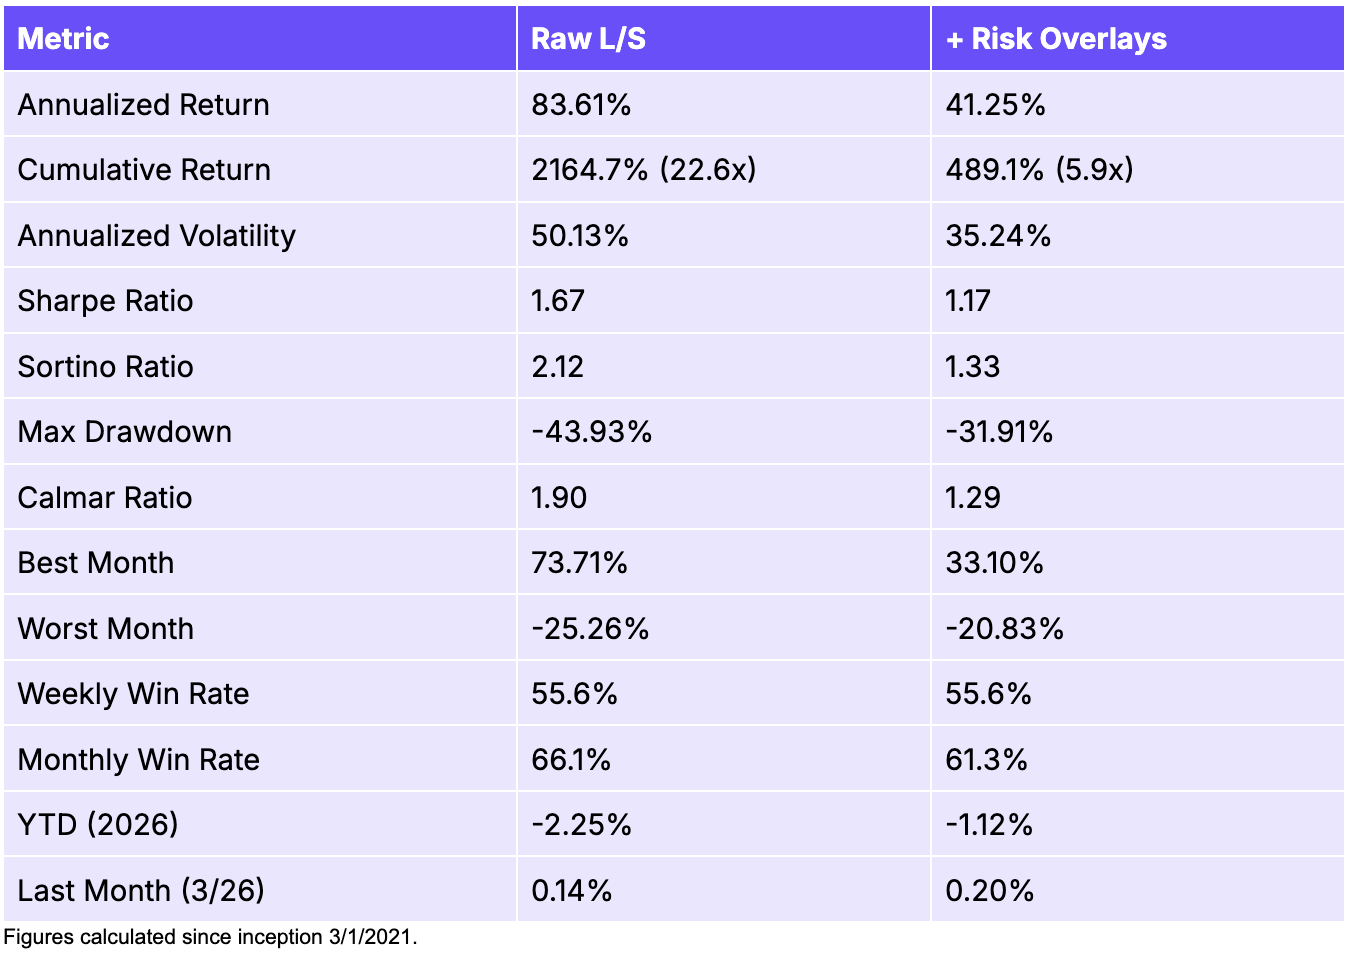
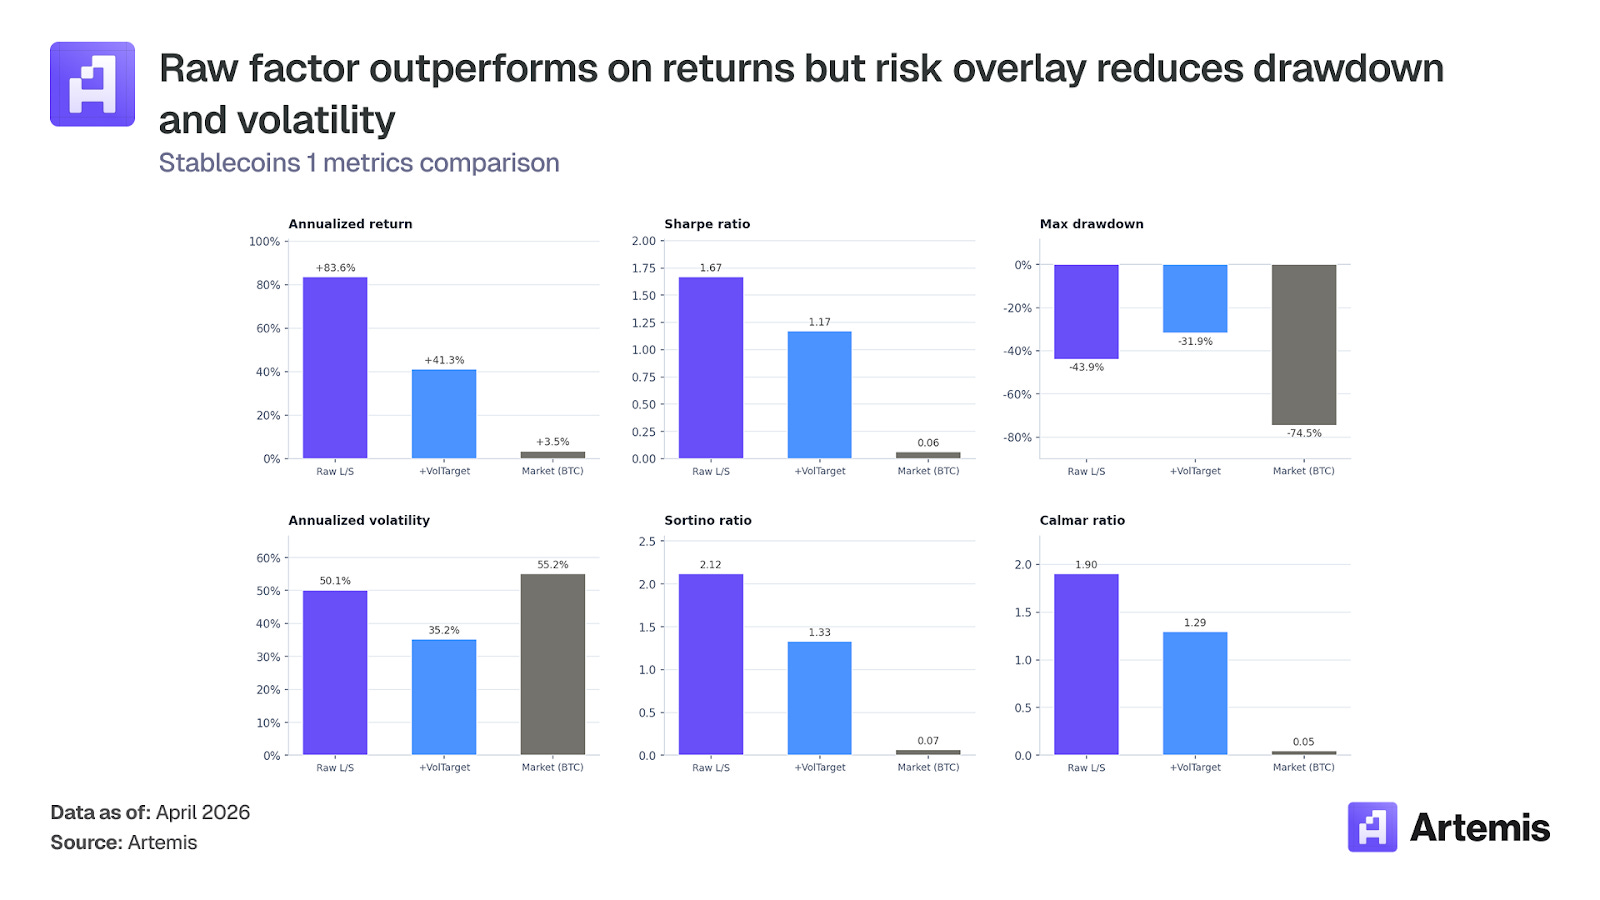
The raw long-short strategy delivers the highest annualized return (+83.6%) and the best Sharpe (1.67), with cumulative returns of +2,164% since inception. Adding the risk overlay reduces the Sharpe to 1.17 but also cuts the max drawdown from -43.9% to -31.9% and the worst month from -25.3% to -20.8%. The risk overlay trades roughly half the raw return in exchange for a meaningfully smoother profile.
Looking at yearly performance, Stablecoins 1’s strongest years were 2021 (+262% raw) and 2025 (+315% raw), with more muted performance in 2022 (+47%) and 2023 (+20%). 2024 was the factor’s one losing year (-13% raw, -18% with overlay), driven by a single sustained drawdown (sets the -43.9% max drawdown) from September to November where chains the signal identified as capital-losing outperformed chains it identified as capital-attracting for roughly two months. The factor recovered fully in Q1 2025 and went on to deliver its best year on record. Solana in particular contributed disproportionately to this period. Short positions on Solana have been the single largest negative contributor across the entire backtest, suggesting the signal does not capture Solana’s idiosyncratic dynamics well, and the September-November 2024 window was one of the periods where this weakness was most acute.
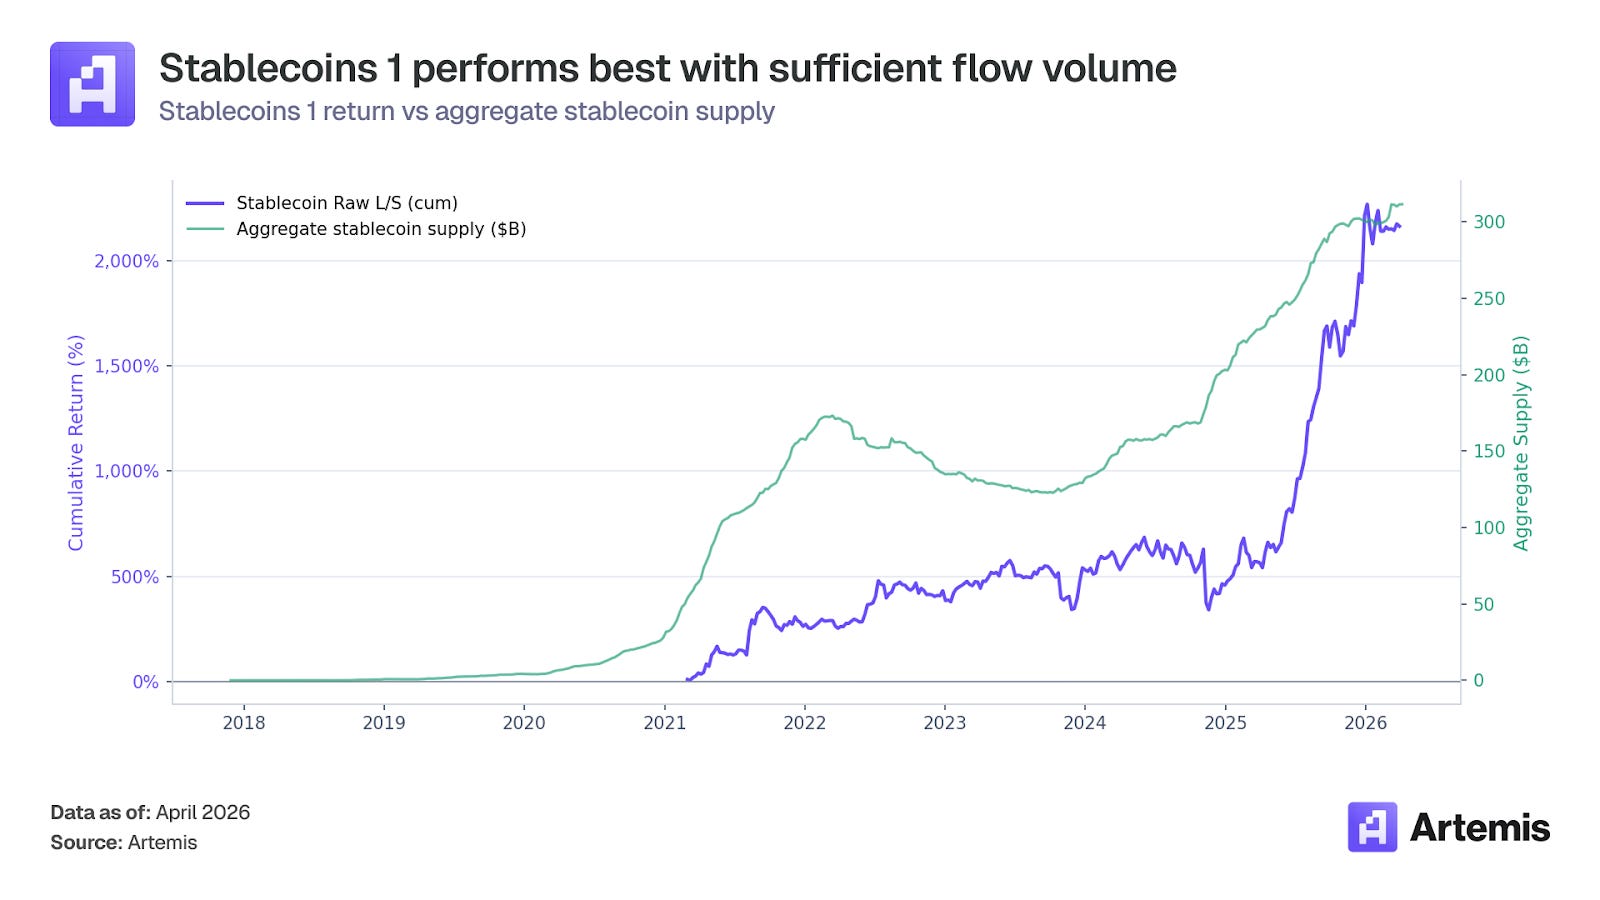
The 2024 drawdown coincided with a period of stagnant aggregate stablecoin supply. Total stablecoins in circulation across the universe had been roughly flat since mid-2022 and didn’t resume meaningful growth until November 2024, as the chart above shows. Cross-sectional factors like this one work best when capital is actively moving at scale: when aggregate supply is expanding, the marginal dollar of new stablecoin issuance has to pick a chain, and those choices reflect real allocation decisions that the factor can profitably rank. When aggregate supply is stagnant, the cross-sectional signal is noisier because the flows that do exist are smaller and more likely to reflect idiosyncratic activity (exchange migrations, bridge events, yield rotations) rather than genuine capital migration. Our regime analysis found that the factor earned +93.9% annualized in weeks when aggregate stablecoin supply was expanding vs +30.2% in contracting weeks, still positive, but meaningfully weaker. The regulatory clarity provided by the GENIUS Act in 2025 and the subsequent institutional issuance wave are plausible drivers of the renewed aggregate growth visible from late 2024 onward, and the factor’s 2025 performance (+315% raw) is consistent with a signal that was always there but needed sufficient flow volume to produce clean cross-sectional dispersion.
Analysis Against the Market
We can compare the performance of Stablecoins 1 with and without the overlays to market (using BTC as proxy for broad crypto market exposure).
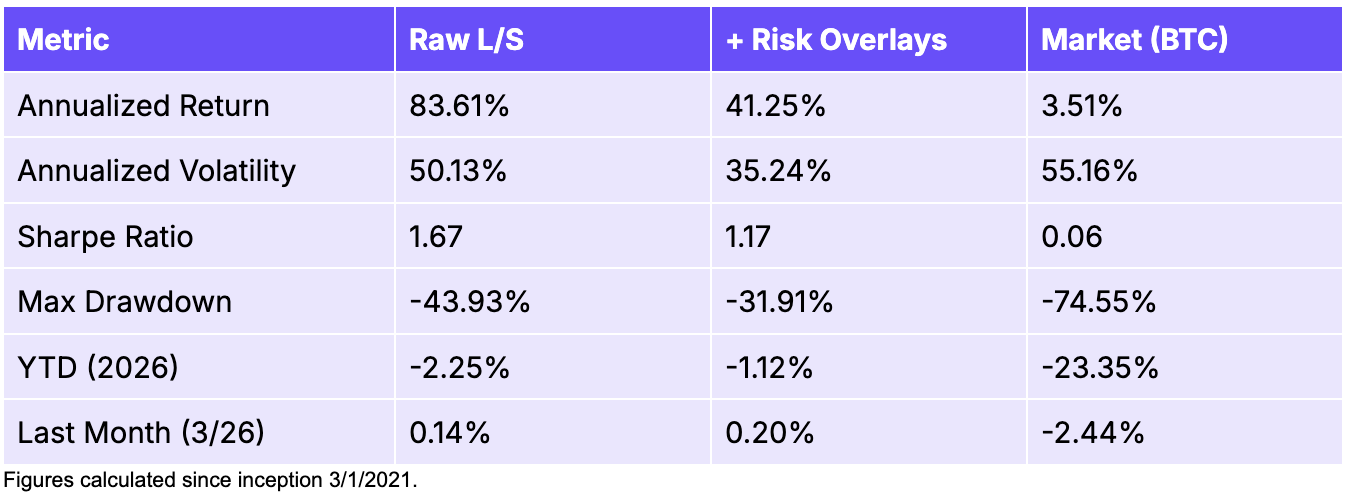
Stablecoins 1, both with and without the risk overlay, dramatically outperformed the market. In terms of monthly outperformance, the Raw L/S strategy beats BTC in 41 of 61 months (67%), and the risk-overlay version beats BTC in 36 of 61 months (59%). BTC delivered only +3.5% annualized over the backtest period with a Sharpe of 0.06 and a -74.5% max drawdown, so both versions of the stablecoin factor offer much better risk-adjusted returns than simply holding crypto.
The more interesting property is the factor’s behavior across market regimes. We split the backtest into months where BTC was positive (31 months) and months where BTC was negative (30 months) and measured the factor’s performance in each.
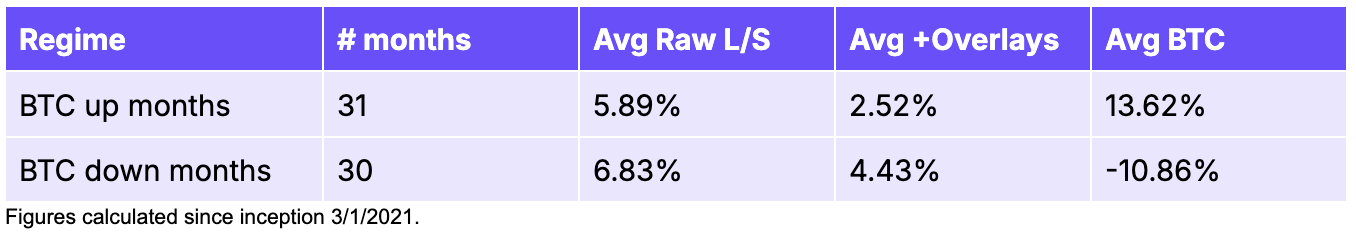
Stablecoins 1 underperforms BTC in rallies (+5.9% vs 13.6% average monthly) because the short leg acts as a drag when most tokens are rising, which is the expected cost of market neutrality. But in BTC negative months, the raw factor averaged 6.8% per month while BTC averaged -10.9%. Not only is the factor positive during drawdowns, it actually performed slightly better in down months than up months. The short leg of chains with contracting stablecoin supply tends to fall greater than the long leg during selloffs, generating positive spread returns exactly when broad crypto exposure hurts the most.
This asymmetry makes Stablecoins 1 valuable as a portfolio diversifier as its return stream actively profits during crypto bear markets.
Market Independence
To test Stablecoins 1’s independence from broad market dependence, we regressed the weekly returns against BTC.
The raw long-short factor has essentially zero market beta (-0.03) and an R² of just 0.1%, meaning less than one-tenth of one percent of the factor’s return variation is explained by whether crypto is going up or down. A t-test on the null hypothesis that beta equals zero fails to reject (p = 0.65), confirming that the long-short construction is statistically indistinguishable from market-neutral. After applying the risk overlay, market beta moves slightly to -0.04 with an R² of 0.4% and is still not statistically different from zero (p = 0.32).
Annualized alpha is +73.8% for the raw factor (t-stat = 3.31, p = 0.001) and +41.6% after the risk overlay (t-stat = 2.66, p = 0.008). Both are statistically significant at the 1% level, indicating the stablecoin factor generates significant returns that cannot be attributed to market exposure.
One question worth addressing is: is this factor a bet on one stablecoin issuer over another? We checked by computing the dollar-weighted USDC, USDT, and “other” share of every long and short pick across the full backtest. The long book averages 46% USDC, 37% USDT, and 17% other stablecoins (DAI, FDUSD, native chain stables, etc.), while the short book averages 37% USDC, 40% USDT, and 23% other. The 9% USDC tilt on the long side is real but modest. The more interesting gap is in the “other” bucket: the factor is meaningfully less likely to go long chains dominated by native or algorithmic stablecoins (cUSD on Celo, FDUSD on BSC). This is consistent with Stablecoins 1’s core thesis of rewarding chains attracting external stablecoin capital and penalizes chains dependent on internally-minted stables. Notably, the chains that drive most of the strategy’s returns span the full composition spectrum (Polygon at 52% USDC, Mantle at 54% USDT, BSC at 54% USDT, Sei at 95% USDC), which is the strongest possible evidence that the factor is a flow-direction bet rather than a stablecoin-issuer bet.
Where the Alpha Comes From
To find what is driving our 1.67 Sharpe, we attributed Stablecoins 1’s cumulative return to each chain individually, splitting contribution between long-leg and short-leg trades using the per-asset weights and forward returns from the backtest.
The long leg is doing nearly all the work. Of the strategy’s total contribution, 84% comes from long positions and only 16% comes from shorts. The factor’s primary alpha source is identifying which chains are gaining capital, not which are losing it.
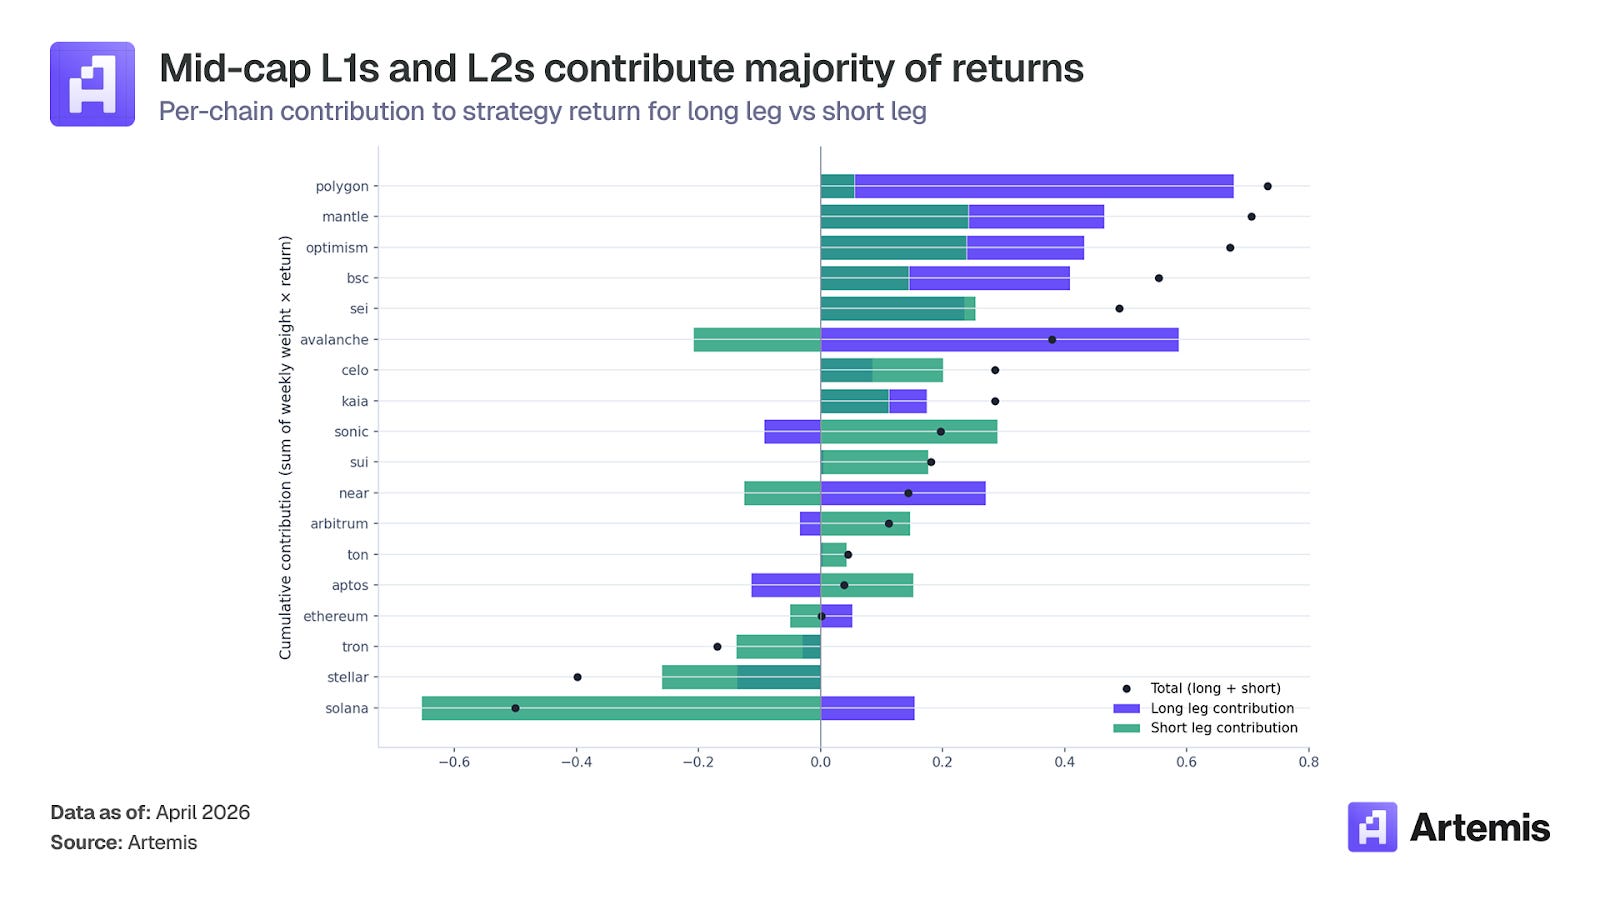
The alpha is concentrated in mid-cap L1s and L2s. The top five contributors are Polygon (+19.5% of total returns), Mantle (+18.8%), Optimism (+17.9%), BSC (+14.8%), and Sei (+13.0%). Together these five chains account for 84% of total strategy returns. They share a profile: chains in the $1-15B stablecoin supply range, mature enough to have meaningful flows but not so dominant that their cross-sectional signal is washed out by a massive base. None of them are in the small-newcomer tier (Sonic, Kaia) or the mega-cap tier (Ethereum, Tron). The factor is fundamentally a positive flow detector for the mid-cap segment.
L2s worked particularly well on this signal. Arbitrum, Optimism, and Mantle together represent 3 of 18 chains (17%) but contribute roughly 40% of total returns, almost entirely from the long side. The cross-sectional signal works particularly well on L2s, likely because L2 stablecoin growth tends to reflect genuine adoption (bridging from L1 to access cheaper transactions) rather than the trader-driven flows that dominate large L1s.
Factor Correlation
We wanted to ensure that Stablecoins 1 is capturing return variation not already covered by factors we already have. To evaluate this, we computed the pairwise correlation between the Stablecoins 1 (S1) and every other factor in our research stack: Fundamentals 1 (F1), SMB (size), Value, Momentum (Momen), Growth, Market (BTC).
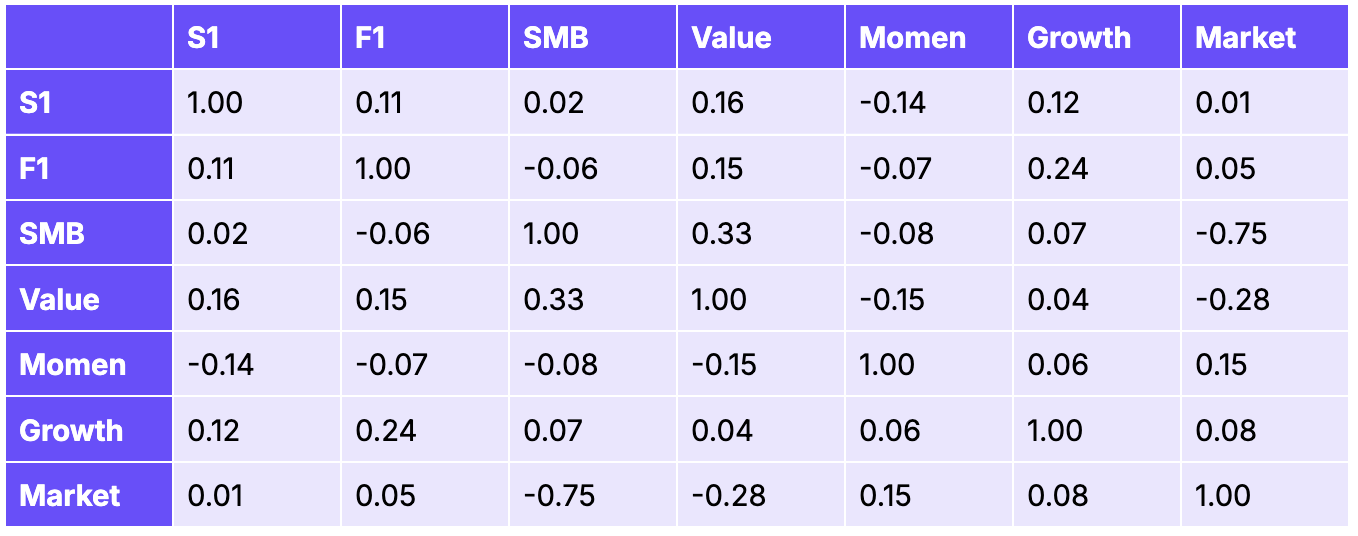
Stablecoins 1 is the least-correlated factor in our entire stack. Its maximum absolute correlation with any other factor is 0.16 (with Value), which shows low pairwise correlation between factors we’ve already built out.
We also ran a spanning regression to make sure that Stablecoins 1 isn’t well-explained by a combination of other factors as well. We regressed Stablecoins 1’s weekly returns against all six other factors simultaneously and tested whether the intercept (alpha) is statistically different from zero. We found an alpha t-statistic of 2.54 (statistically significant at the 1% level), with an R² of just 6.1%. In other words, 94% of the Stablecoin Factor’s variance cannot be explained by any linear combination of our other factors. Whatever this factor is capturing, it is genuinely orthogonal to every other alpha source we have built.
When we tested multi-factor portfolios across our existing factors, Stablecoins 1 consistently appeared at 10-20% weight in all top-performing combinations. This shows that the factor is genuinely orthogonal and profitable: too small a weight to dominate, but always present.
Stablecoins 1 is not a substitute for any factor we already have; it’s not a repackaging of momentum, value, or size when you regress them out. It measures something different (capital migration between chains as a leading indicator of token returns) and it gets paid for measuring it.
Key Takeaways
Stablecoin capital flows predict cross-sectional L1 returns. Stablecoins 1 delivers a 1.67 Sharpe with +83.6% annualized return over five years, with a conservative out-of-sample Sharpe estimate of 0.96 after a degrees-of-freedom haircut.
Stablecoins 1 is the most market-independent alpha source we have built. Market beta is -0.03 with an R² of just 0.1%, and Stablecoins 1 is the least-correlated factor in our entire stack (max pairwise correlation 0.16). Annualized alpha is +73.8% (t-stat 3.31) for the raw factor after controlling for market exposure.
It performs best in down markets. Across 30 BTC-negative months in the backtest, the raw factor averaged +6.8% per month while BTC averaged -10.9%. Stablecoins 1 doesn’t just survive crypto bear markets, it actively profits from them.
The alpha comes from being long mid-cap chains. The long leg generates 84% of returns, and the top five contributors (Polygon, Mantle, Optimism, BSC, Sei) account for 84% of total returns.
Stablecoins 1 is genuinely orthogonal to every other factor we have built. After controlling for all other factors simultaneously in a spanning regression, the stablecoin factor retains a t-statistic of 2.54 and an R² of just 6.1% meaning 94% of its variance is unique. Adding it to existing multi-factor portfolios consistently improves Sharpe.
Performance has been resilient across multiple market regimes, with strong years in 2021 (+262%), 2022 (+47%), and 2025 (+315%). Stablecoins 1’s one losing year (2024, -13%) coincided with stagnant aggregate stablecoin supply growth, and performance recovered immediately when the ecosystem resumed expanding.
If you have any questions, feel free to reach out to team@artemis.xyz or shoot us a DM on X.com @Artemis.
 | A guest post by
|