
Crypto Factor Model Analysis: Launching Fundamentals 1
A systematic framework for identifying outperformers in crypto using on-chain fundamentals like users, revenue, and valuation

An analysis on systematizing on-chain fundamentals to obtain excess returns in crypto. The factor strategy that we created is called “Fundamentals 1” and is referred to throughout.
Main Takeaway: Tokens with growing user bases, reasonable fee valuations, and active revenue dynamics systematically outperform those without, delivering a 1.73 Sharpe over 4+ years.
Executive Summary
We constructed a weekly-rebalanced long-short factor from on-chain fundamentals: DAU growth, revenue quality, revenue stability, and valuation mean reversion.
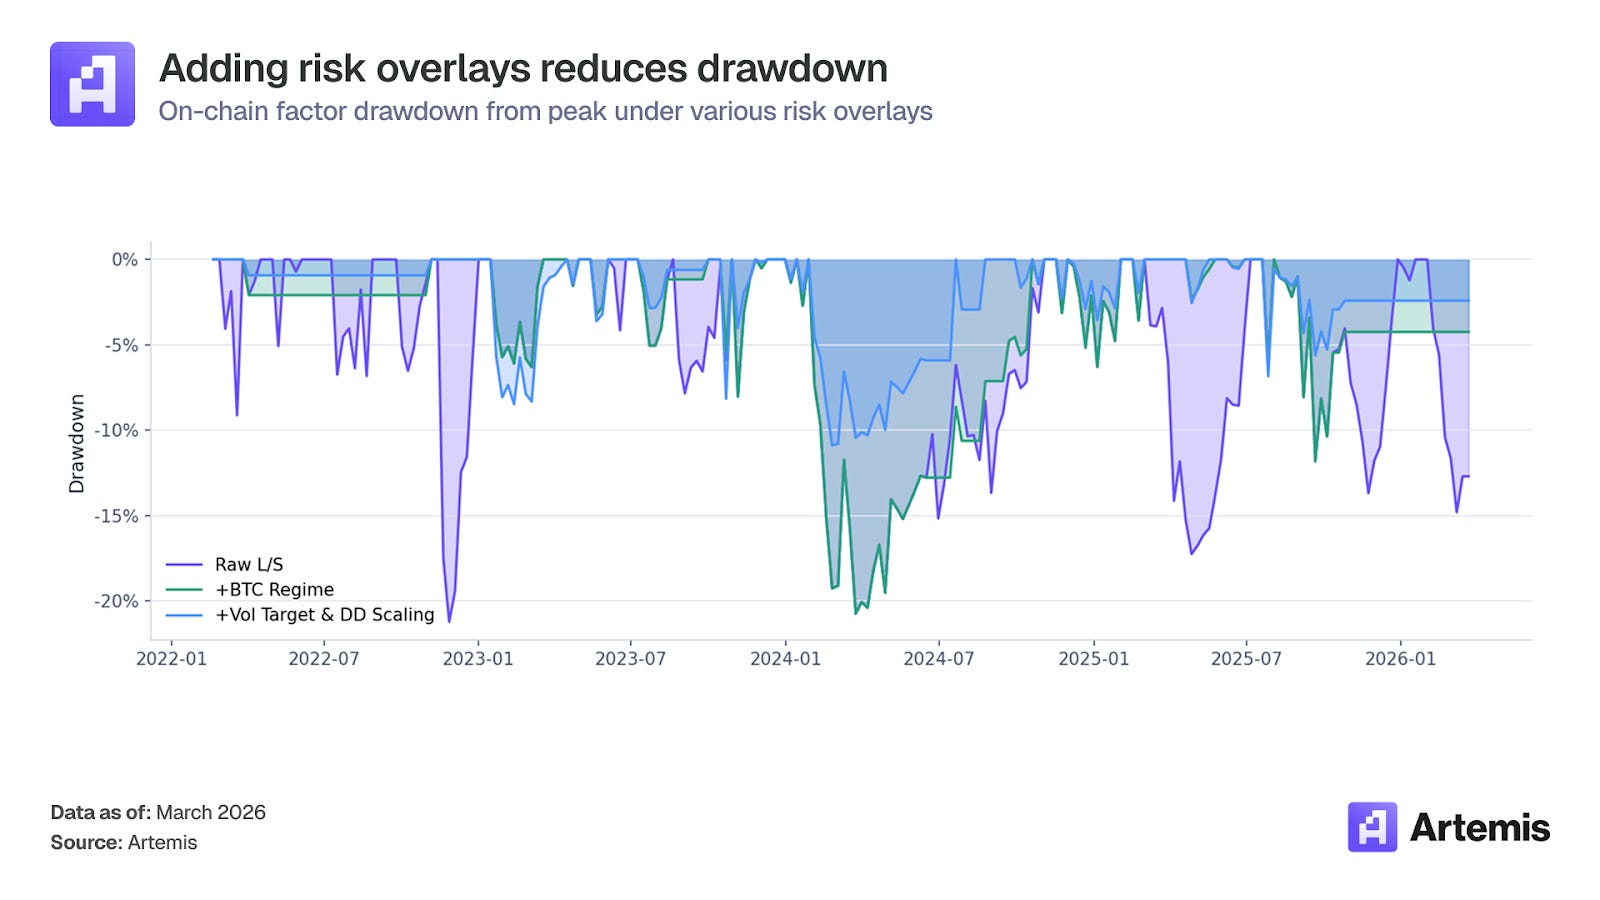
Adding risk overlays (BTC regime filter, volatility targeting, drawdown scaling) reduces the Sharpe to 1.73 but cuts max drawdown in half to -10.9% (as opposed to 1.83 Sharpe and -21.20% max drawdown without overlays).
Fundamentals 1 is effectively market neutral: market beta is 0.05 (not significant) with an R2 of 0.6%. Less than 1% of the factor’s return variation is explained by broad crypto market direction.
Fundamentals 1 performs slightly better in down markets than up markets (+4.53% vs +4.22% average monthly return), demonstrating the diversification value of long-short fundamental selection.
Alpha is statistically significant at the 1% statistical significance level across all layers, with +51.7% annualized alpha for the raw factor after controlling for market exposure.
Goal
The purpose of this model is to determine if it’s possible to systematically identify which crypto tokens will outperform and underperform in the next week based on their on-chain fundamental health.
The underlying thesis is that on-chain data (fee revenue, users, revenue stability) can tell you something about future token returns that price and volume alone won’t capture. Tokens with growing user bases and reasonable valuations relative to their fundamentals tend to outperform while tokens with declining usage or bloated valuations tend to lag.
To learn more about our methodology, request detailed testing results, or explore commercial opportunities, please reach out to the Artemis team.
Process
The Fundamentals 1 model constructs a cross-sectional long-short factor using on-chain fundamental data to rank and trade liquid crypto tokens. The portfolio is rebalanced weekly using simple USD returns, with the backtest starting in February 2022 (earliest data with sufficient scored assets meeting all eligibility and data quality criteria).
Data is sourced from Artemis Analytics for all on-chain fundamentals (fees, revenue, daily active users, market capitalization) and token pricing. Bridge flows data is sourced from Artemis.
Returns are gross of transaction costs; realized performance would depend on execution costs and liquidity at time of trade. The breakeven transaction cost is estimated to be 138 bps per trade.
The Fundamentals 1 factor portfolio is constructed from eligible assets at each time period (weekly) per the following criteria:
≥ $100M market cap at rebalancing period
≥ $10M daily trading volume at rebalancing period
Minimum asset history of 13 weeks before eligible for inclusion
Excluded: stablecoins, pegged assets, tokenized treasuries, exchange entities, index tokens, and infrastructure aggregates
This ensures that illiquid and microcap tokens whose volatility would distort factor returns are not included. The criteria produces a universe of about 112 eligible assets per week, of which about 60 have sufficient on-chain data to receive a composite score.
Signal Construction
To pick the signals for our fundamental factor model, we start with 25 signals across momentum, value, and quality indicators and 13 flow-based signals using bridge data. Many signals were eliminated because of negative predictive power redundancy measured by high correlation (several signals were 85%+ correlated with each other), or poor predictive power.
Ranking by predictive strength, filtering for redundancy, and testing every combination left us with four signals: DAU growth, inverted active revenue share, revenue stability, and MC/fees mean reversion. These signals are nearly uncorrelated with each other (all below 0.12), span three categories, and the four-signal composite outperformed every broader combination.
The four signals are computed as follows for each eligible asset:
DAU Growth: Momentum signal measuring the percentage change in daily active users (DAU) over a trailing window; captures user adoption momentum.
Inverted Active Revenue Share: Measures the proportion of revenue derived from passive sources (MEV, liquidations, incentive programs) rather than active user transactions. Tokens with lower active revenue share tend to outperform in the short term, likely reflecting capital attracted by incentive programs.
Revenue Stability: Measures the inverse volatility of revenue growth; less stable growth is associated with higher forward returns, consistent with a risk premium.
Market Cap/Fees Mean Reversion: Measures the negative z-score of the market-cap-to-annualized-fees ratio against its own history and identifies tokens that are cheap relative to their own fundamental valuation history.
Each signal requires a minimum of 8 non-zero observations within a 13-week eligibility window. Raw signal values are winsorized at the 1st and 99th percentiles to limit outlier influence, then converted to cross-sectional rank z-scores each week. Rank-based normalization is used to handle the heavy-tailed distributions of typical crypto data.
Portfolio Construction
The four rank-scores signals are then combined into an equal-weight composite score. An asset requires a minimum of 2 of 4 signals to receive a composite score. The composite is then re-ranked to produce the final asset ranking each week.
Assets are then sorted into quintiles based on the composite ranking. The portfolio goes long the top quintile (~12 assets with highest composite score) and short the bottom quintile (~12 assets with lowest composite score) with equal-weighting within each leg.
Risk Overlays
There are three layers of risk management applied in sequential order to the raw long-short portfolio:
BTC Regime Filter: Binary filter based on Bitcoin’s 20-week simple moving average. When BTC is trading below its 20-week SMA, all positions are scaled to zero. This reduces exposure during broad crypto drawdowns.
Volatility Targeting: Position sizes are scaled each week so that the portfolio’s trailing 8-week realized volatility targets 15% annualized. A maximum leverage cap of 1.5x is applied.
Drawdown Scaling: Exposure is linearly reduced starting at a -10% drawdown from peak equity, reaching zero exposure at -20% to protect against sustained losses.
On the position level, there is a 20% maximum weight per individual asset and 40% maximum allocation to any single sector. Rebalance changes below 2% are skipped to reduce any unnecessary turnover.
Performance & Results
Backtested Performance
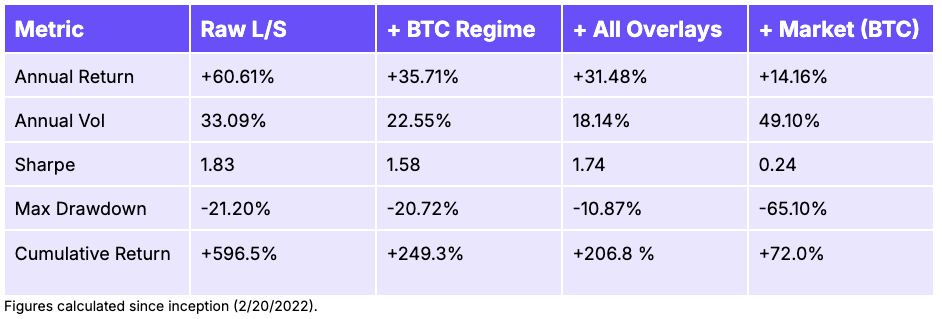
Since inception at the start of 2022, we can look at the return of Fundamentals 1 without the risk overlays (raw), with only the Bitcoin regime filter, and with all three risk overlays (Bitcoin regime, volatility targeting, drawdown scaling). Note that the regime filter was triggered for late 2025 and all of 2026 as BTC has been below its 20-week SMA since roughly November 2025.
The results are backtested and gross of fees and transaction costs. In practice, transaction costs, borrowing costs for shorts, and potential liquidity constraints could all reduce net returns. We estimate the breakeven transaction cost, which is the per-trade cost the strategy can absorb while still netting positive returns, to be approximately 138 basis points.
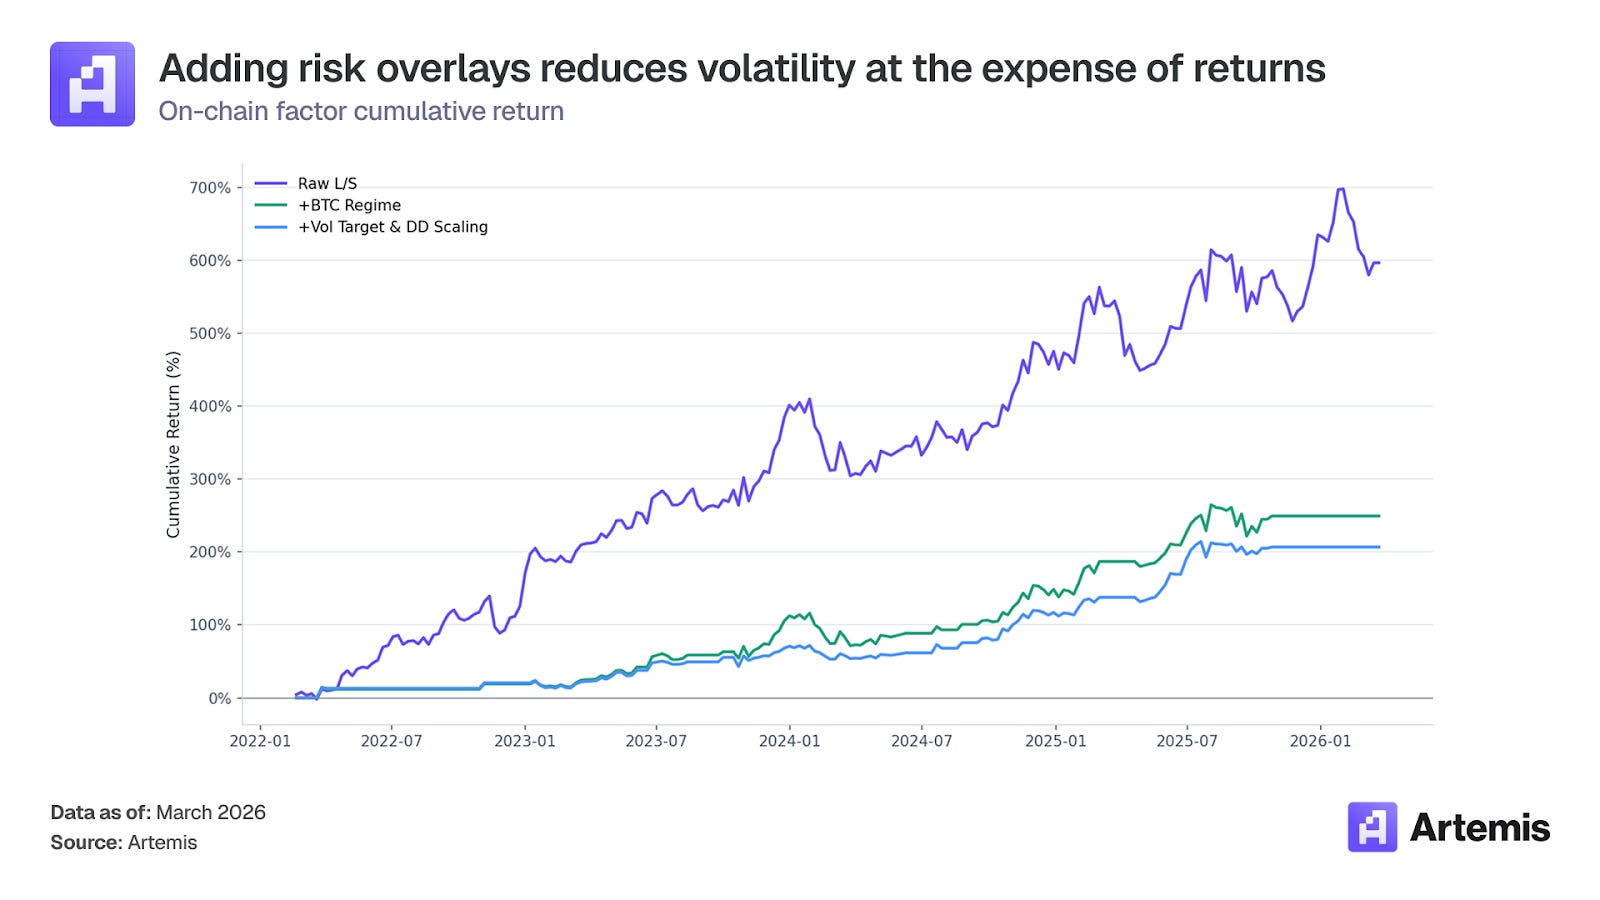
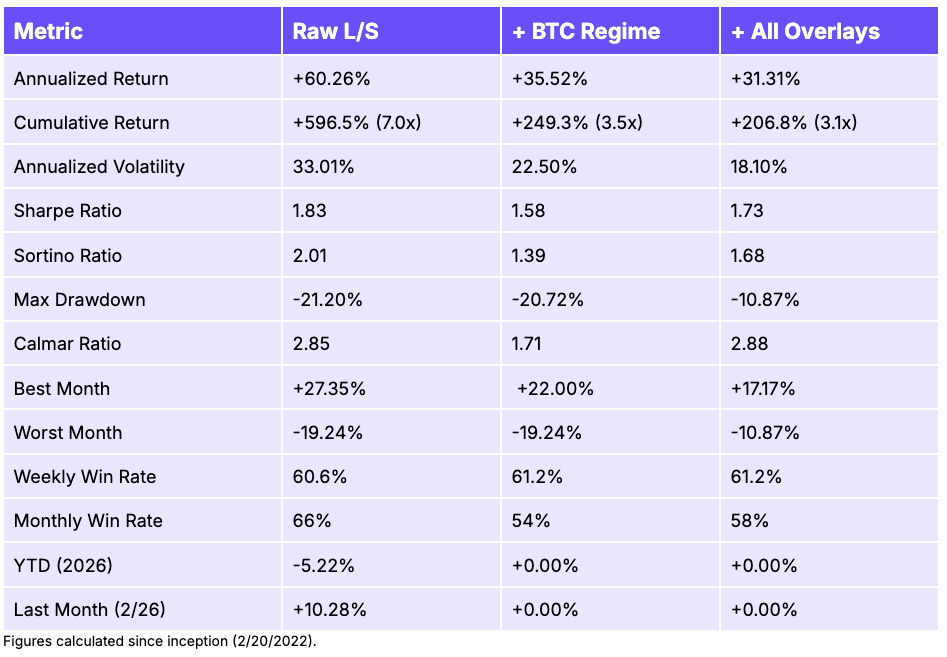
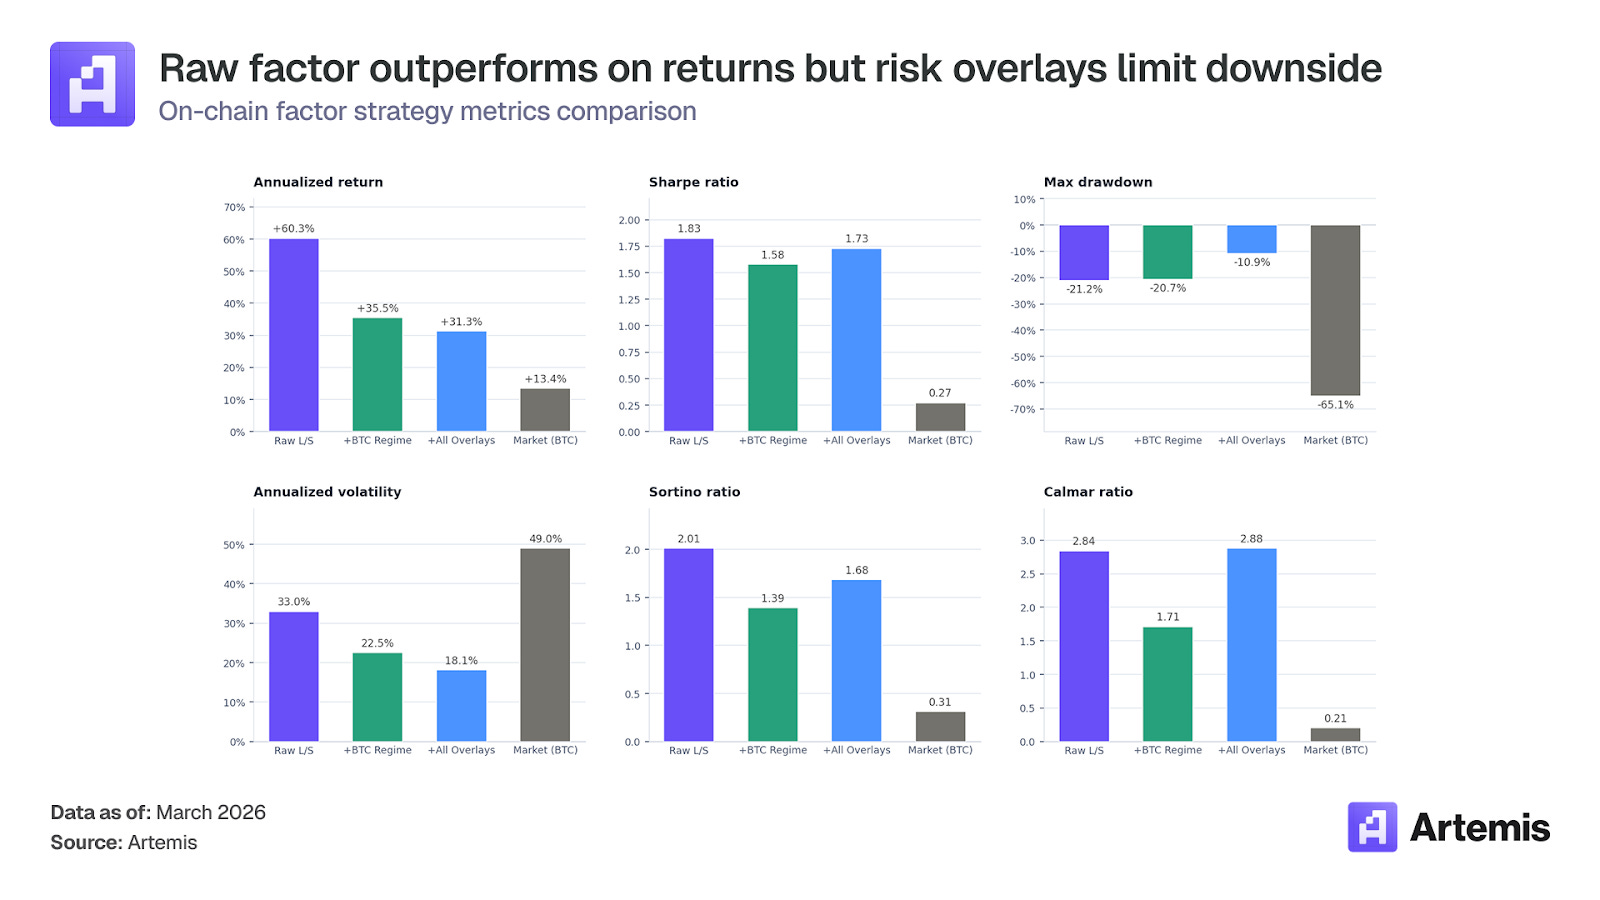
The three layers demonstrate the tradeoff between raw return and risk management. The raw long-short strategy delivers the highest annualized return (+60.3%) but carries 33% volatility and a -21.2% max drawdown. Adding the BTC regime filter cuts volatility to 22.5% and keeps Fundamentals 1 flat during broad crypto drawdowns, at the cost of roughly a third of the raw return. Layering on volatility targeting and drawdown scaling compresses volatility further to 18.1% and cuts the max drawdown nearly in half to -10.87%, while improving the Sharpe ratio from 1.58 with only the regime filter to 1.73 Sharpe with the additional overlays. The full overlay stack gives up return for a significantly smoother profile as the Calmar ratio of 2.88 (return per unit of max drawdown) is the highest of all three layers.
Looking at yearly performance, Fundamentals 1’s strongest years were 2022 and 2023 with raw returns of +126% and +122%, respectively. This is notable because 2022 was a deep crypto bear market where BTC fell from $47K to $16K yet Fundamentals 1 was able to deliver its best annual performance. Performance moderated in 2024 (+15% raw) and 2025 (+40% raw). As the crypto market matured and more capital flowed into fundamentals-based strategies, the spread between best and worst tokens compressed and the signal weakened, although it stayed positive.
Annual performance was markedly different after adding the risk overlays. In 2022, the regime filter held Fundamentals 1 flat for most of the year (due to BTC bear market), reducing the returns to +19% (from +126% raw). This shows how the filter protects against drawdowns but also removes Fundamentals 1 from periods where the long-short spread is the widest. In 2023, BTC recovered and returns increased (+78% with regime vs +122% raw). By 2024-2025 the overlay returns exceeded the raw returns (2025 full overlay returned +41% vs raw 28%). This happened because the regime filter successfully kept Fundamentals 1 flat during losing weeks that the raw signal traded through and the vol targeting scaled up exposure during lower-volatility periods when the signal was performing well.
Today, the regime filter has been triggered since November 2025. The raw signal is slightly negative (-5.2%) while the overlay is keeping Fundamentals 1 flat during current market weakness.
Analysis Against the Market
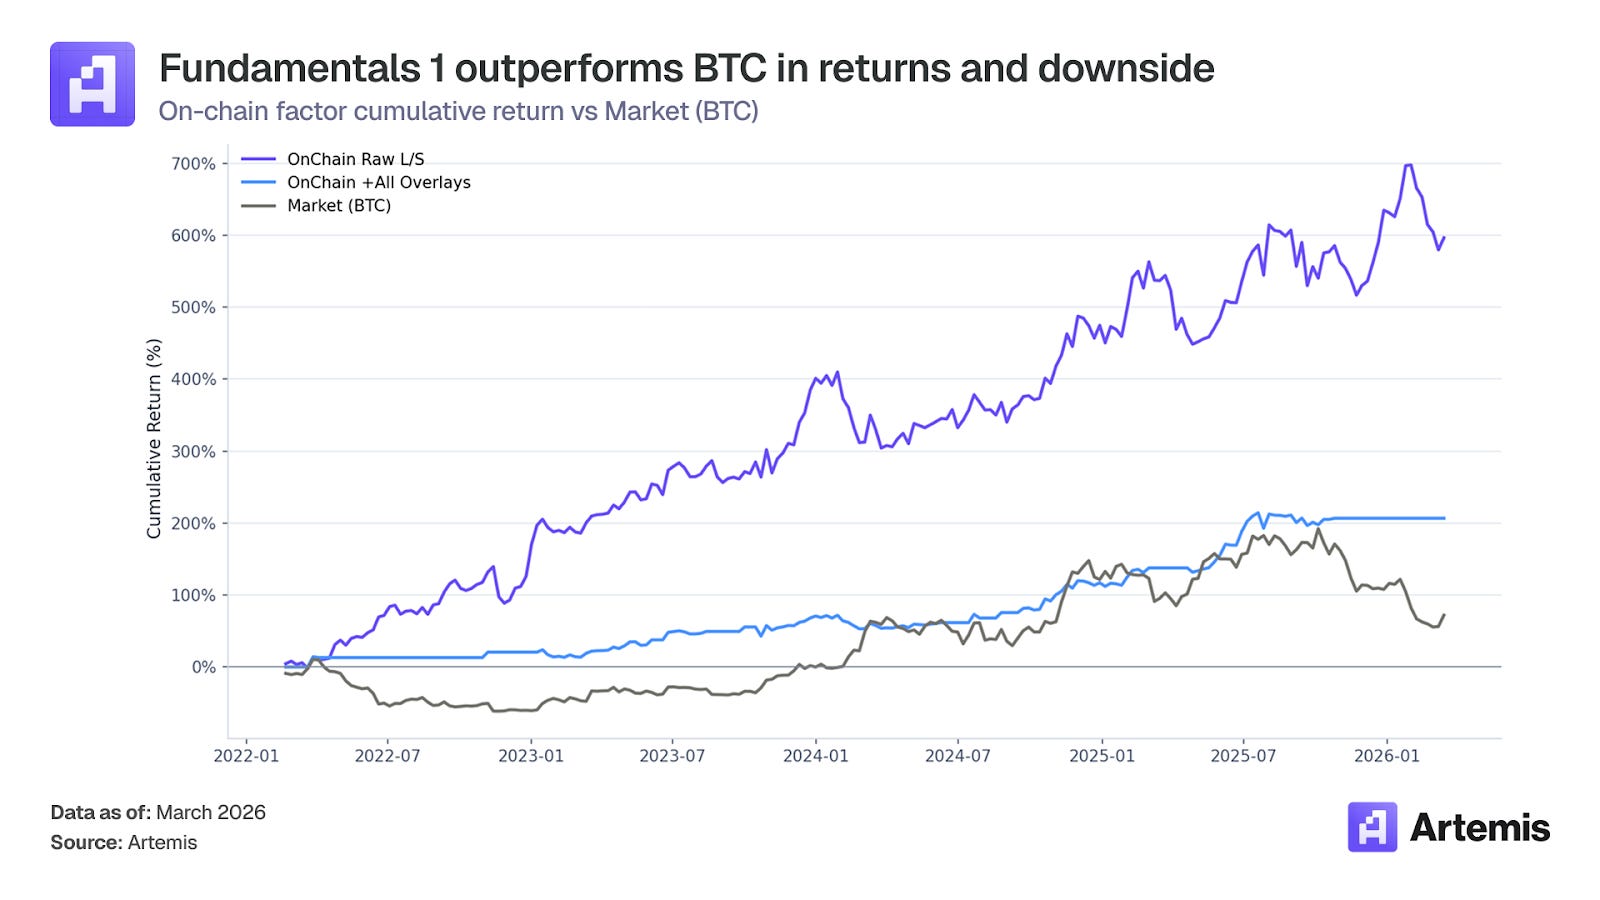
We can compare the performance of Fundamentals 1 with and without the overlays to market (using BTC as proxy for broad crypto market exposure).
Fundamentals 1, both with and without the risk overlay, outperformed the market. In terms of monthly outperformance, the Raw Long/Short strategy beats BTC in 30/50 months (60%) while adding all risk overlays beats BTC in 28/50 months (56%).
Additionally, one of the core advantages of a long-short factor strategy is the ability to generate returns regardless of market direction. To test this, we split the backtest into months where BTC was positive (26 months) and months where BTC was negative (24 months).
In BTC positive months, the raw factors averaged +4.22% per month while BTC averaged +14.02%. The factor underperforms in rallies because the short leg acts as a drag when most tokens are rising; an expected cost of market neutrality.
However, in BTC negative months, the raw factor averaged +4.53% per month while BTC averaged -10.36%. Fundamentals 1 is not only positive during drawdowns but actually performed slightly better in down months than up months. This is because the short leg of tokens with weak fundamentals tend to fall harder than the long leg during selloffs, generating positive spread returns.
This asymmetry is what makes Fundamentals 1 valuable as a portfolio diversifier over a standalone directional bet, and why Sharpe is so high relative to just going long Bitcoin.
Market Independence
To test Fundamentals 1’s independence of broad market dependence, we regressed the on-chain fundamentals factor’s weekly returns against BTC.
The raw long-short factor has near-zero market beta (0.05) and an R2 of 0.6%, meaning less than 1% of the factor’s return variation is explained by whether crypto is going up or down. A t-test on the null hypothesis that beta equals zero fails to reject (p > 0.05), confirming that the long-short construction is effectively market-neutral.
After applying the risk overlays, market beta rises slightly to 0.08 with an R2 of 4.7%. In this case, the t-test rejects the null that beta equals zero (p < 0.05), meaning the overlay version does carry a small but statistically significant market exposure. This is expected as the BTC regime filter mechanically introduces some market correlation by only allowing positions when BTC is above its 20-week SMA. The tradeoff is a meaningfully reduced drawdown portfolio.
Annualized alpha is +51.7% for the raw factor (t-stat=3.16, p=0.002) and +27.0% after all risk overlays (t-stat=3.07, p=0.002). Both are statistically significant at the 1% level, indicating Fundamentals 1 generates returns that can’t be attributed to market exposure.
Factor Correlation
Weekly return correlation between the raw factor and BTC is +0.075, rising to +0.22 with risk overlays applied. For context, the November 2025 factor model analysis found cross-factor correlations ranging from -0.07 to +0.29, so the Fundamental 1’s market correlation falls within the range of existing independent factors.
Key Takeaways
On-chain fundamentals predict cross-sectional crypto returns. Tokens with growing user bases, reasonable fee valuations, and active revenue dynamics systematically outperform those without, delivering a 1.73 Sharpe over 4+ years.
Fundamentals 1 is independent of market direction. With near-zero market beta and an R2 of 0.6%, the factor captures something genuinely different from whether crypto is going up or down. Fundamentals 1 was most profitable during the 2022 bear market.
Risk overlays improve the risk profile without destroying alpha. The full overlay stack cuts max drawdown from -21% to -11% and improves the Calmar ratio to 2.88, the highest of all three layers.
Signal strength has moderated in recent years. 2022-2023 raw returns averaged +124% annually versus +28% in 2024-2025. The alpha is still positive, but the opportunity set compressed as the market matured.
Fundamentals 1 adds diversification to existing crypto portfolios. Its low correlation to market (+0.075) and positive returns in down markets make it valuable as a complement to directional crypto exposure.
If you have any questions, feel free to reach out to team@artemis.xyz or shoot us a DM on X.com @Artemis.
 | A guest post by
|