
Reading the TEA (Total Economic Activity) Leaves: the metric that matters for blockchains.
Total Economic Activity is a better metric in our opinion compared to REV, Chain Fees to measuring and valuing blockchains.


Abstract
Blockchains have evolved beyond just being digital transaction ledgers. They are now complex, decentralized ecosystems where users, consumers and developers build businesses and interact with each other. Applying bottom-line valuations to blockchains doesn’t work. Instead of treating blockchains as simple products, we at Artemis believe that valuing blockchains as individual economies is a better framework.
Introducing TEA: Total Economic Activity
TEA = Chain Fees & MEV + Settlement Volume + Application Fees
We have created a new metric to measure the size and economic activity of blockchains. Where prior metrics fall short in adequately measuring the value of total activity on blockchains, TEA shines. It is flexible and widely applicable to chains with various use cases and user behaviors. All core categories of on-chain actions are captured and measured by TEA. Interestingly, it also has a strong relationship with market cap.

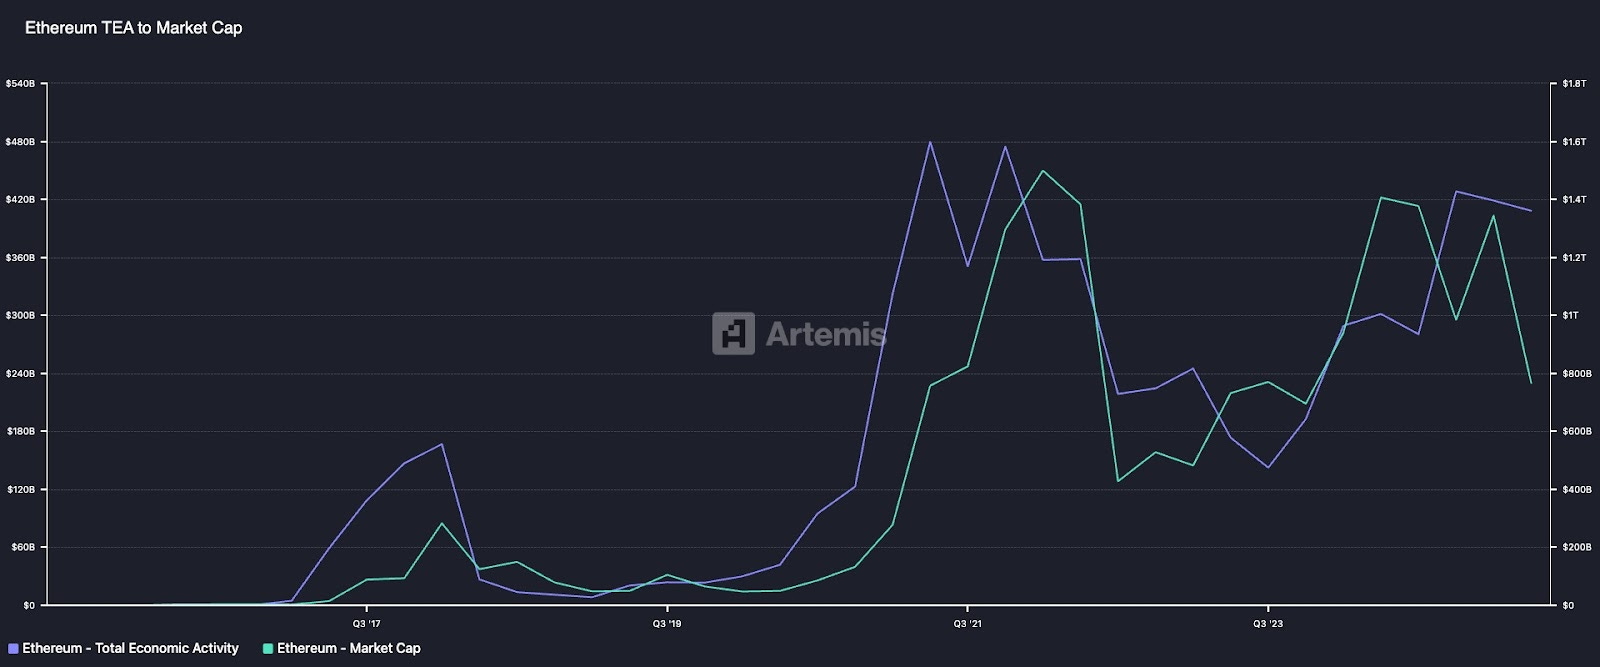
On a quarterly basis, Ethereum TEA has a 0.93 correlation to market cap. There is a fundamental relationship between TEA and how the market values blockchains.
This post sets out to provide greater context on why that is, and why viewing blockchains as economies is the most appropriate framework. We discuss the pros and cons of prior methods of valuing economic activity, explain the methodology behind TEA in more detail, and share our results and findings across several chains.
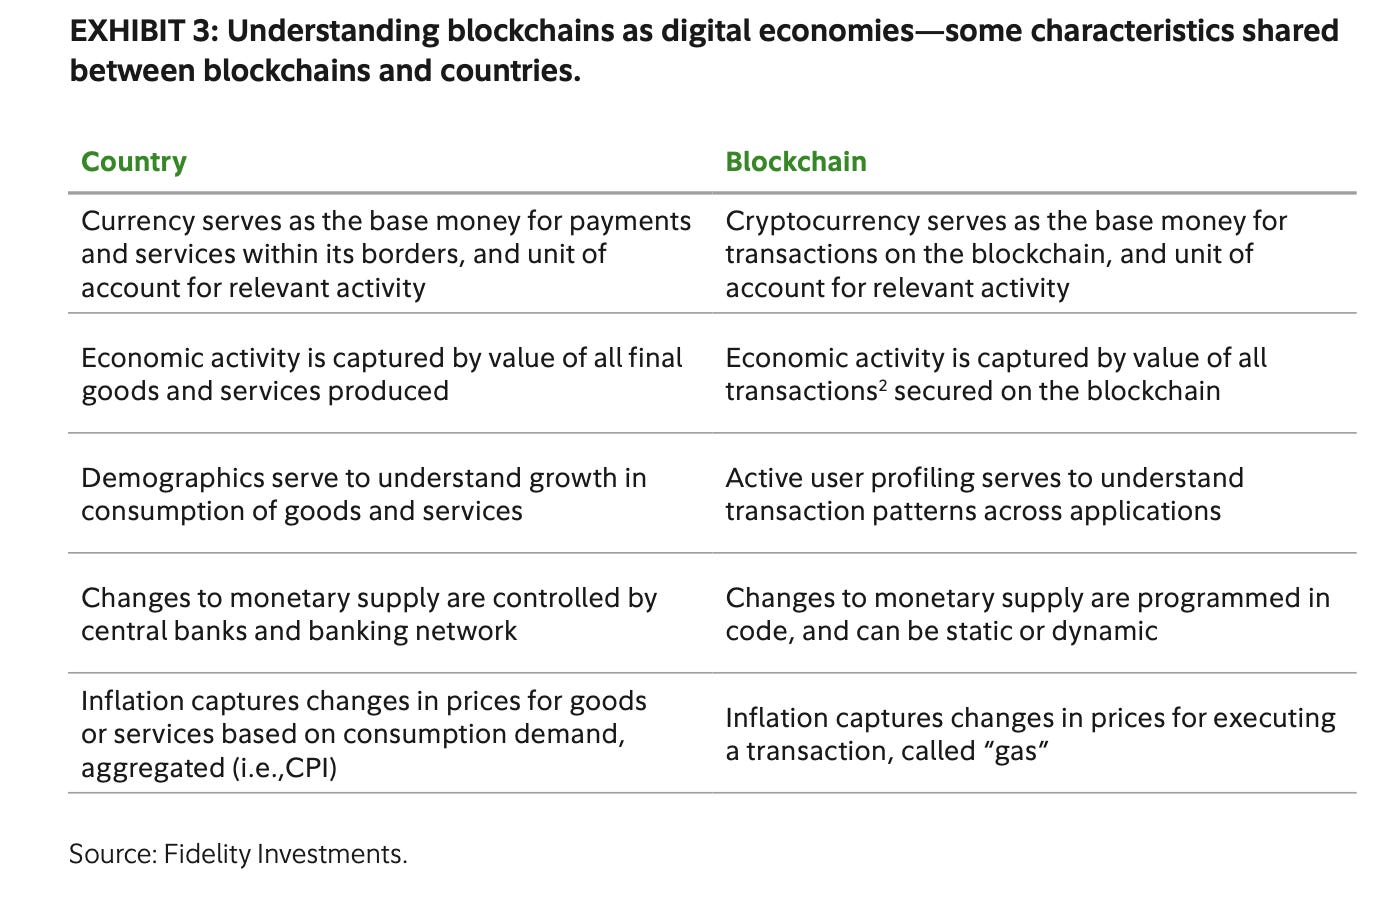
Blockchains As Economies
An economy is a system through which people, businesses, and the government decide how to use limited resources to make, use, and share goods and services within a geographical region. Blockchains have consumers (users), businesses (dApps), governments (foundation/node operators and DAOs), scarce resources (computing power and tokens), and goods and services (DEXes, lending platforms, stablecoin operators, etc.). And while blockchains are global entities, they are self-contained to the virtual machine and validator network that maintain the system.
Having established the parallels between blockchains and economies, the question becomes: How do we value blockchains as economic systems?
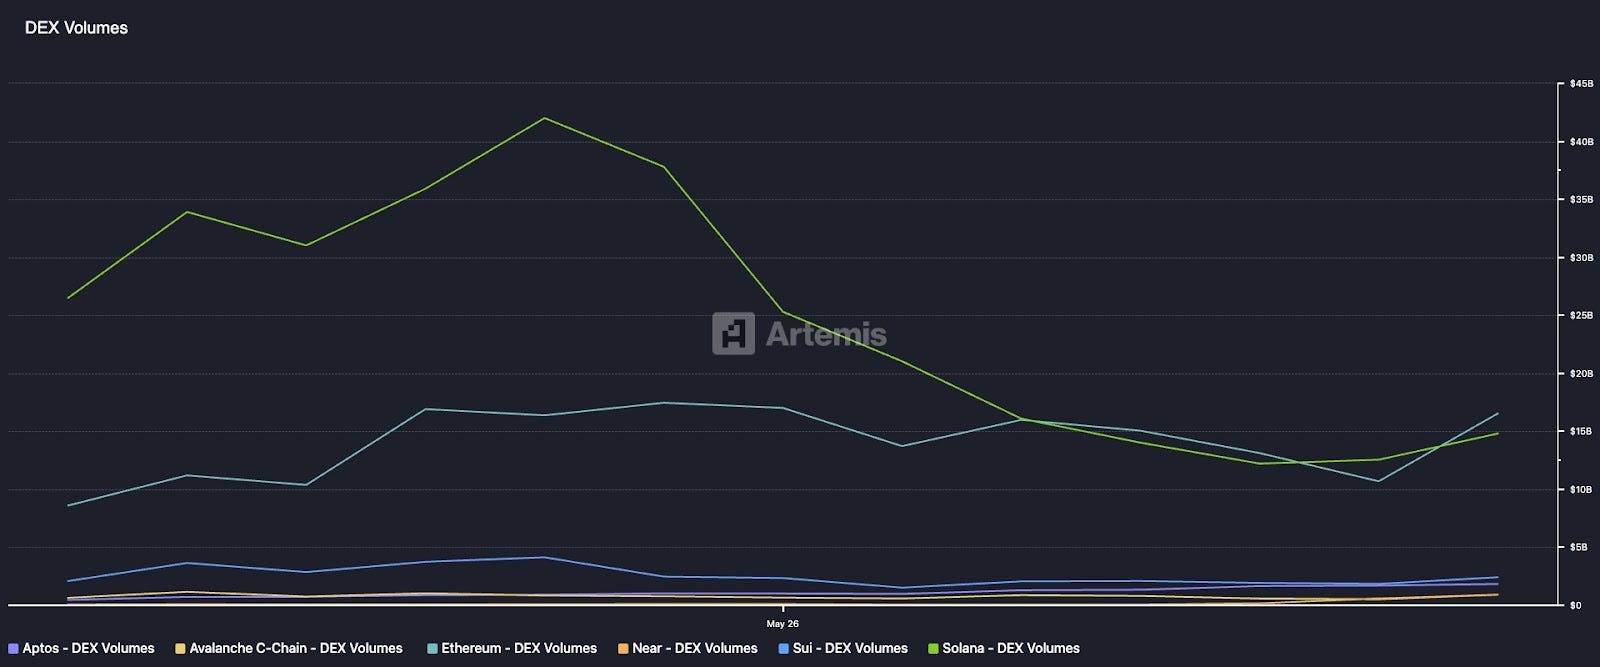
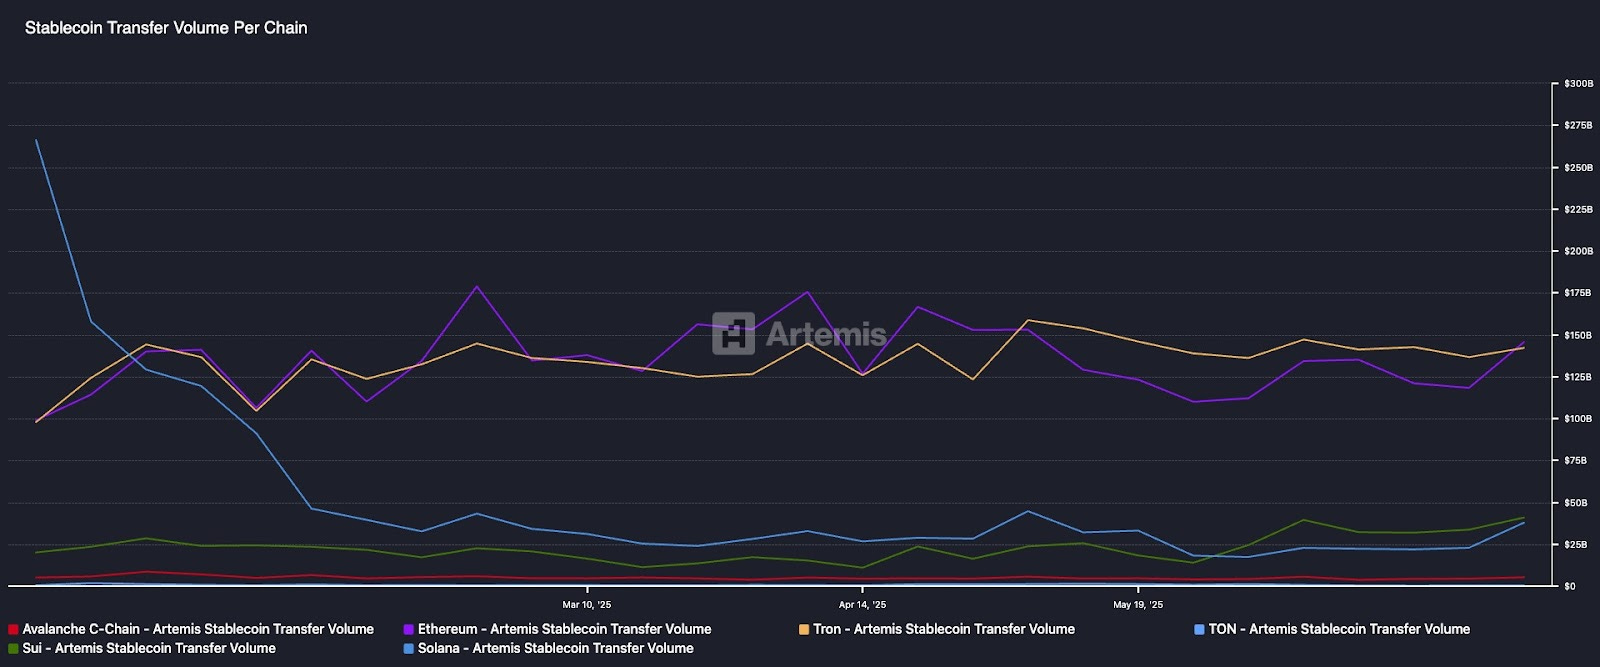
Blockchains vary drastically with each other. For instance, while Solana has been dominating on-chain finance and dex volumes, Ethereum and Tron have generated a tremendous amount of activity from stablecoin transfers.
Because different on-chain actions generate different kinds of value, we arrive back at the question: Is there a standardized, widely applicable way of measuring the size and economic activity of blockchains given their varying types of usage?
Prior Methods to Measure Economic Activity
Before we get into our approach of measuring economic activity, it would be helpful to provide a brief overview of other methods and their strengths and weaknesses.
GDP
Since its creation in 1934, GDP (gross domestic product) has been the go-to measurement for economic activity. It’s defined as the final value of all goods and services produced within an economy over a period of time. The most common way to calculate GDP is the expenditure method, i.e. the total expenditure of all stakeholders in an economy, which factors in consumer expenditure, capital investments, trade and government spending. The GDP metric on TokenTerminal measures the total fees generated by all on-chain applications - i.e. the total expenditure of a user to consume blockchain applications. While this is a useful way to measure the output of applications in blockchain ecosystems, it excludes the value captured through gas fees and MEV. Furthermore, it also excludes remittance payments and P2P blockchain activity that doesn’t utilize any dApps, which makes up a large amount of blockchain economic activity.
However, our biggest concern with using GDP as a measure of blockchain activity is that the metric makes several key assumptions that fall short in blockchain economies.
GDP does not count reselling tokens: Traditional GDP only counts the final goods, and not the value of intermediate goods that were transacted to make the final good (while buying a phone is counted in GDP, buying metal, glass, silicon, etc. are not included in the metric). This is because GDP is meant to measure new output of an economy as a way to calculate economic activity, not calculate all activity indiscriminately. This means that it excludes reselling activity as well. Applied to blockchains, this would mean that a GDP measure must only calculate newly minted tokens (new output) and exclude any token exchanges between consumers. Obviously, this is infeasible.
GDP excludes P2P transfers: Because P2P transfers do not translate to consumption or production of final goods, GDP excludes these transfers as well. However, a considerable amount of economic activity on blockchains includes remittance payments and P2P transfers, excluding these would massively understate economic activity.
GDP does not include digital investments: Perhaps the biggest drawback of GDP is that it does not account for investments in stocks, bonds, ETFs or crypto. The reason is to avoid double counting because of the underlying assumption that the money used to purchase these assets will then be spent on “final goods and services” that are already factored into GDP. In crypto, however, investing in crypto is the primary economic activity on blockchains. Using GDP as a metric would not account for this activity.
While it might help to use GDP as a way to frame blockchain activity, it feels inappropriate to redefine so many assumptions that have defined the metric for nearly a century.
REV
Real Economic Value (REV) is a metric defined by Blockworks Research to track how much users pay to use blockchains, including MEV and tips. As a refresher, MEV (Maximal Extractable Value) is the max value block producers can extract by arranging the ordering of transactions within a block. The REV metric intends to measure the demand for blockspace and the costs that users are willing to pay to have their transaction included in a block. The key assumption is that higher economic activity translates to higher demand for blockspace which is represented by REV. However, while REV is useful to analyze the value captured by the blockchain, we believe that it fails to accurately represent economic activity or value.
REV essentially tracks payments to the blockchain by users to operate within its economy, similar to how we pay taxes to operate within a country’s economy. As a simple analogy, let’s say economic activity were to be measured by the taxes paid by consumers and businesses to the government. In times of economic booms, one can expect the inflows to the government to increase (higher expenditure leading to higher indirect taxes for instance); but this doesn’t mean that we can use taxes as an indicator for economic activity. An increase in direct taxes could increase inflows to the government, but would actually decrease economic activity. REV is simply a measure of how much value a blockchain can capture – it isn’t always an accurate depiction of the blockchain’s economic activity.
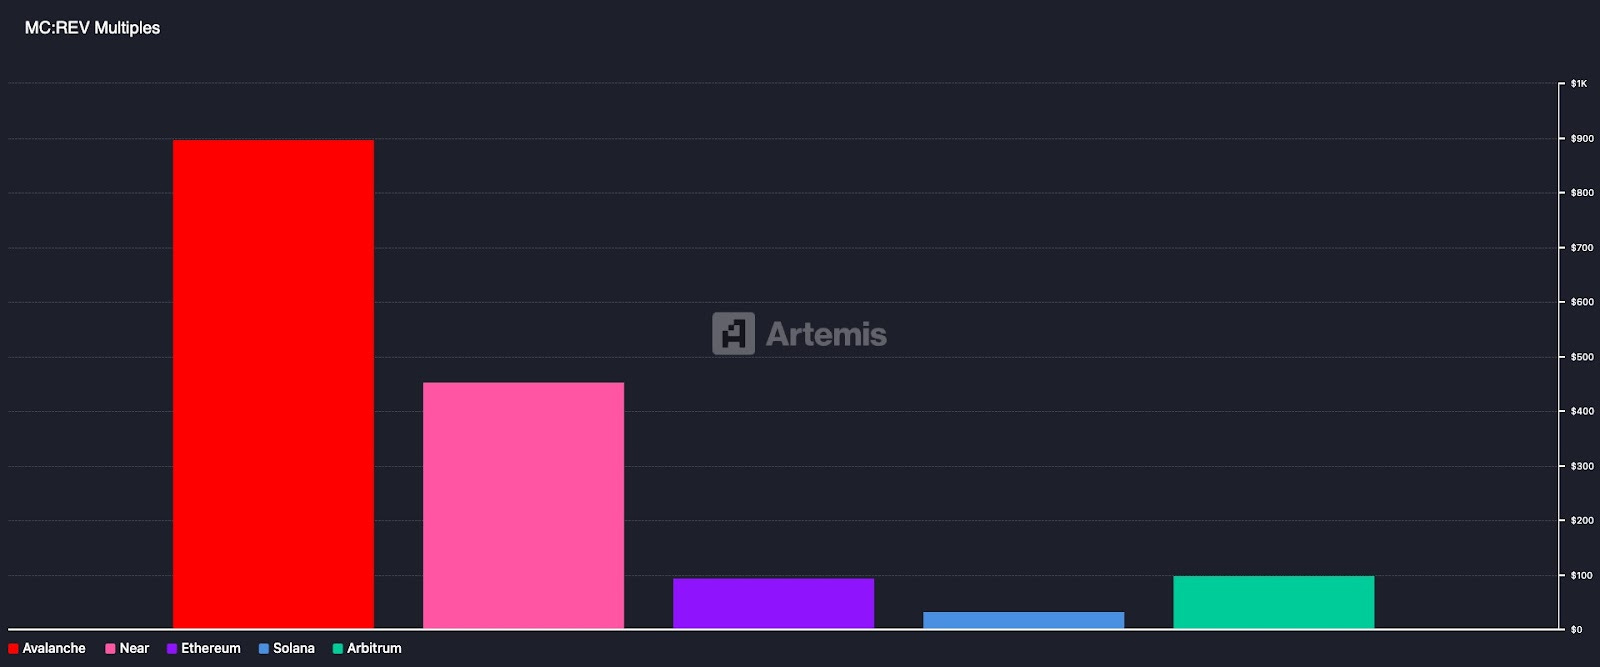
An extension to this point is that over time, we expect the value captured by infrastructure to decrease relative to the value captured by applications. In traditional web infrastructure for example, we saw that value initially flowed to semiconductors (AMD & Intel), then to infrastructure (Azure & AWS), and now most of the value is currently held by applications like Adobe and Salesforce. This isn’t just a prediction anymore; applications make up 4 of the top 5 revenue-generating protocols in crypto. Notably, applications have drastically lower market cap / revenue multiples compared to blockchains (Hyperliquid has a ratio of 20.6x compared to Ethereum with a ratio of 1800x), pointing to a huge undervaluation in the market. This shows that a massive amount of user spend is making its way to applications and blockchains are capturing smaller and smaller portions of it.
Additionally, REV can vary between chains because they are structurally different from each other and not because of real economic activity. Because REV measures two things - chain fees and MEV - differences like block sizes, spam transactions, private mempools, and so on will drastically affect REV calculations. MEV is a major component of REV and in some cases can surpass the total fees generated by the blockchain alone. It could overstate meaningful economic activity, which might affect measurements of the metric.
For these reasons, we believe REV, while useful in some ways, is not an ideal way to measure and value blockchains. It also results in incredibly large multiples for some major chains such as Avalanche (893) and Near (453), which will only become more exacerbated as fees trend towards zero.
A Holistic Approach to Measuring Economic Activity
As we saw above, it is difficult to value economic activity uniformly across blockchains with differing use cases and patterns of user behavior. TEA solves this problem. The core intent of the Total Economic Activity (TEA) metric is to measure all forms of economic activity occurring on-chain. Together these components provide a full view of the total value transacting on a blockchain:
Chain Fees & MEV
This includes gas fees paid to execute transactions, blob fees (if applicable), and MEV including priority fees / ordering fees. These are costs users pay for blockspace.
Settlement Volume
The dominant component of TEA is what we call Settlement Volume. This includes DEX Volumes, NFT Volume, and P2P Transfer Volume (incl. native, token and stablecoin transfers). These three categories of activity capture the transactional value of the most common economic actions users take on-chain. It is more encompassing than other metrics that focus purely on native token value associated with a transaction, and is more widely applicable to a variety of chains given their different use cases (ie: NFT focused chains, remittance based chains, etc.). Net deposits and borrows have been excluded from settlement volume for two reasons – application fees from lending activity are already reflected in TEA; and borrowed tokens are typically swapped or transferred which would already be recorded.
Application Fees
Finally, fees collected by applications for usage of their products and services are included in the metric. This is akin to the service component within the consumption category of GDP, and provides a holistic view of transaction value when combined with settlement volume and chain fees.
TEA provides a standardized way to measure economic activity for a wide variety of blockchains, regardless of their niche use cases, user patterns or lifecycle age.
Findings & Implications
Below is a breakdown of TEA on Ethereum, showing each individual component of this metric:
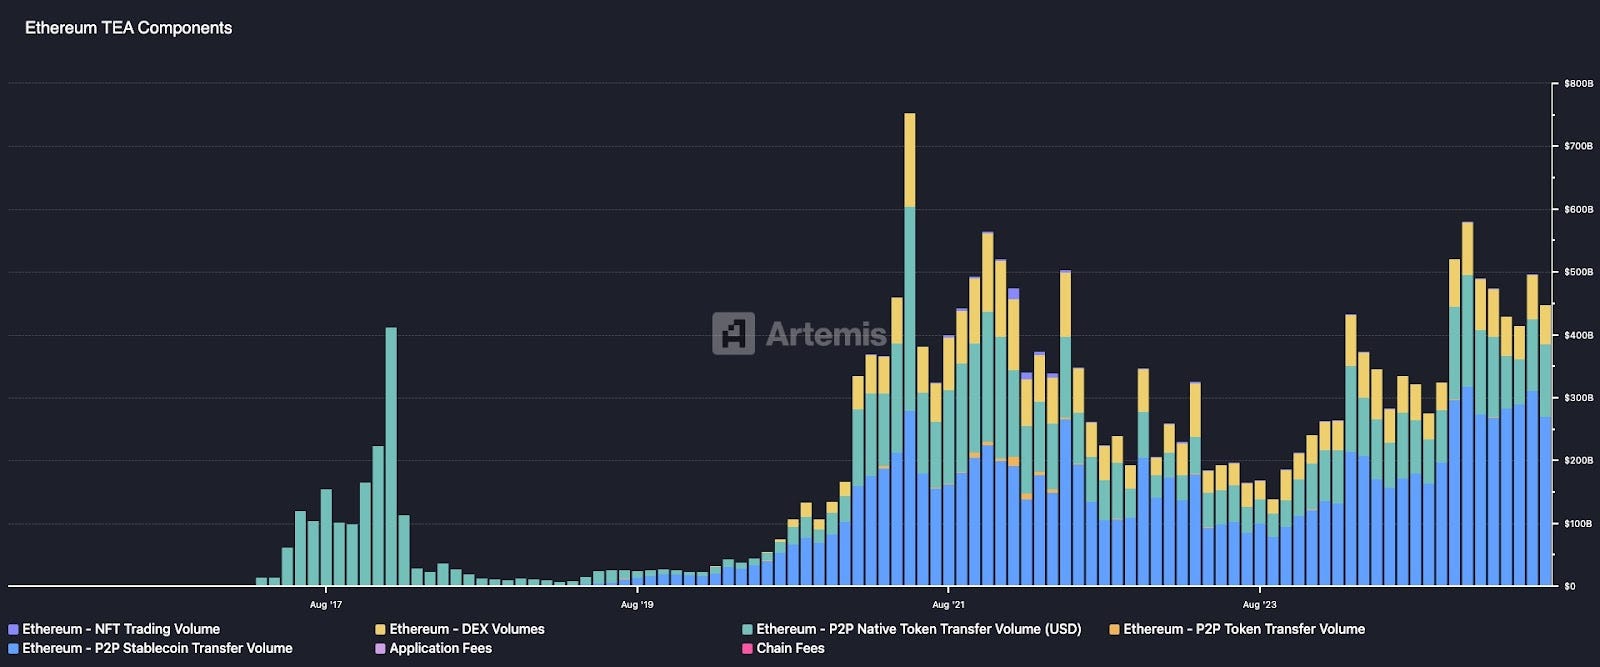
All major categories of on-chain activity are captured in TEA, making it flexible and widely applicable to any blockchain regardless of the chain’s primary use-case. It is as applicable to NFT-centric chains such as Zora or Shape as it is to remittance-based chains and general-purpose L1s. TEA also allows for economic activity on low-cost chains to be valued equally to chains with higher transaction fees. Because Chain Fees are only one component of TEA, there is much less bias attributed to fee structures compared to other fee-based valuation frameworks.
For chains with predominantly non-value bearing transactions, economic activity can be measured via their Chain Fees component. Due to this flexibility TEA is uniquely capable of measuring the value of economic activity occurring on any chain.
The below chart shows aggregate TEA for major chains for the month of June 2025:
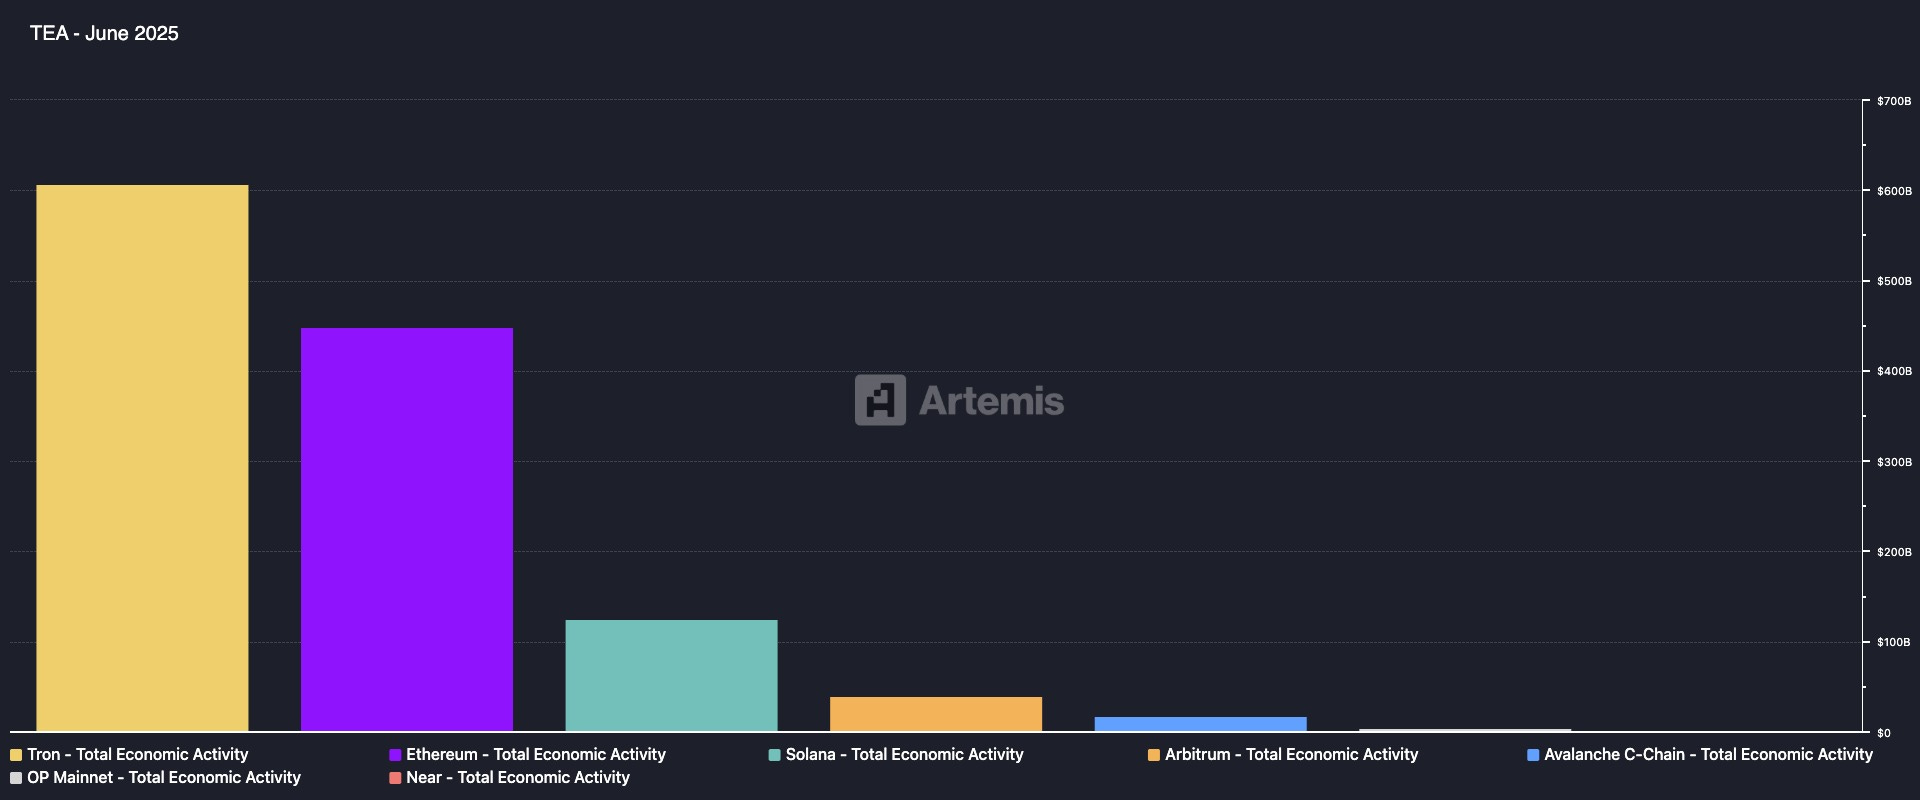
This snapshot view of TEA provides a clear way to gauge the level of economic activity and size of these on-chain economies at a single point in time. It is incredibly useful for comparative analysis of aggregate economic activity across multiple chains. In this example we can see the stark difference between the multiple of 448 for Ethereum TEA (~$448B) vs. Near TEA (~$1B) despite a lower multiple of 117 when comparing market caps ($365B vs. $3.1B).
We can also view TEA for these chains historically to see how these on-chain economies have grown and evolved over time:
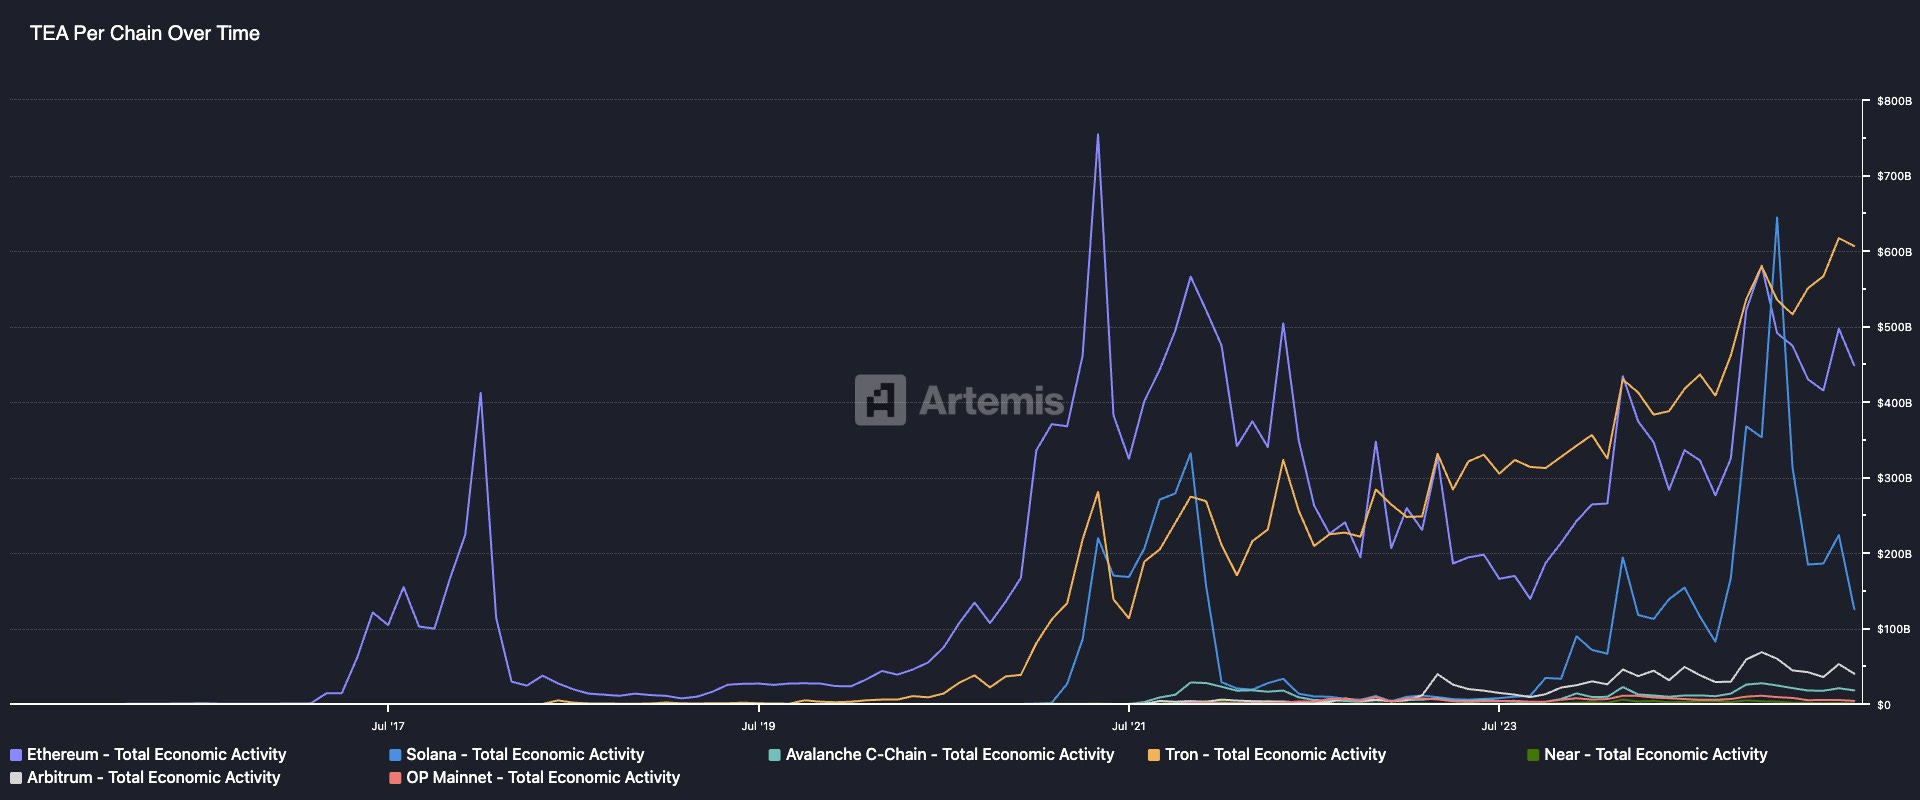
Notice the steadily increasing TEA of Tron, relative to the more cyclical TEA of other chains such as Ethereum and Solana. This chart highlights how effective this metric is at standardizing economic activity across chains with different use-cases (ex: Tron which is primarily used for P2P stablecoin transfers, vs. Ethereum which is more general-purpose and has many different categories of activity).
Another useful framing of TEA is in conjunction with market cap as a valuation metric:
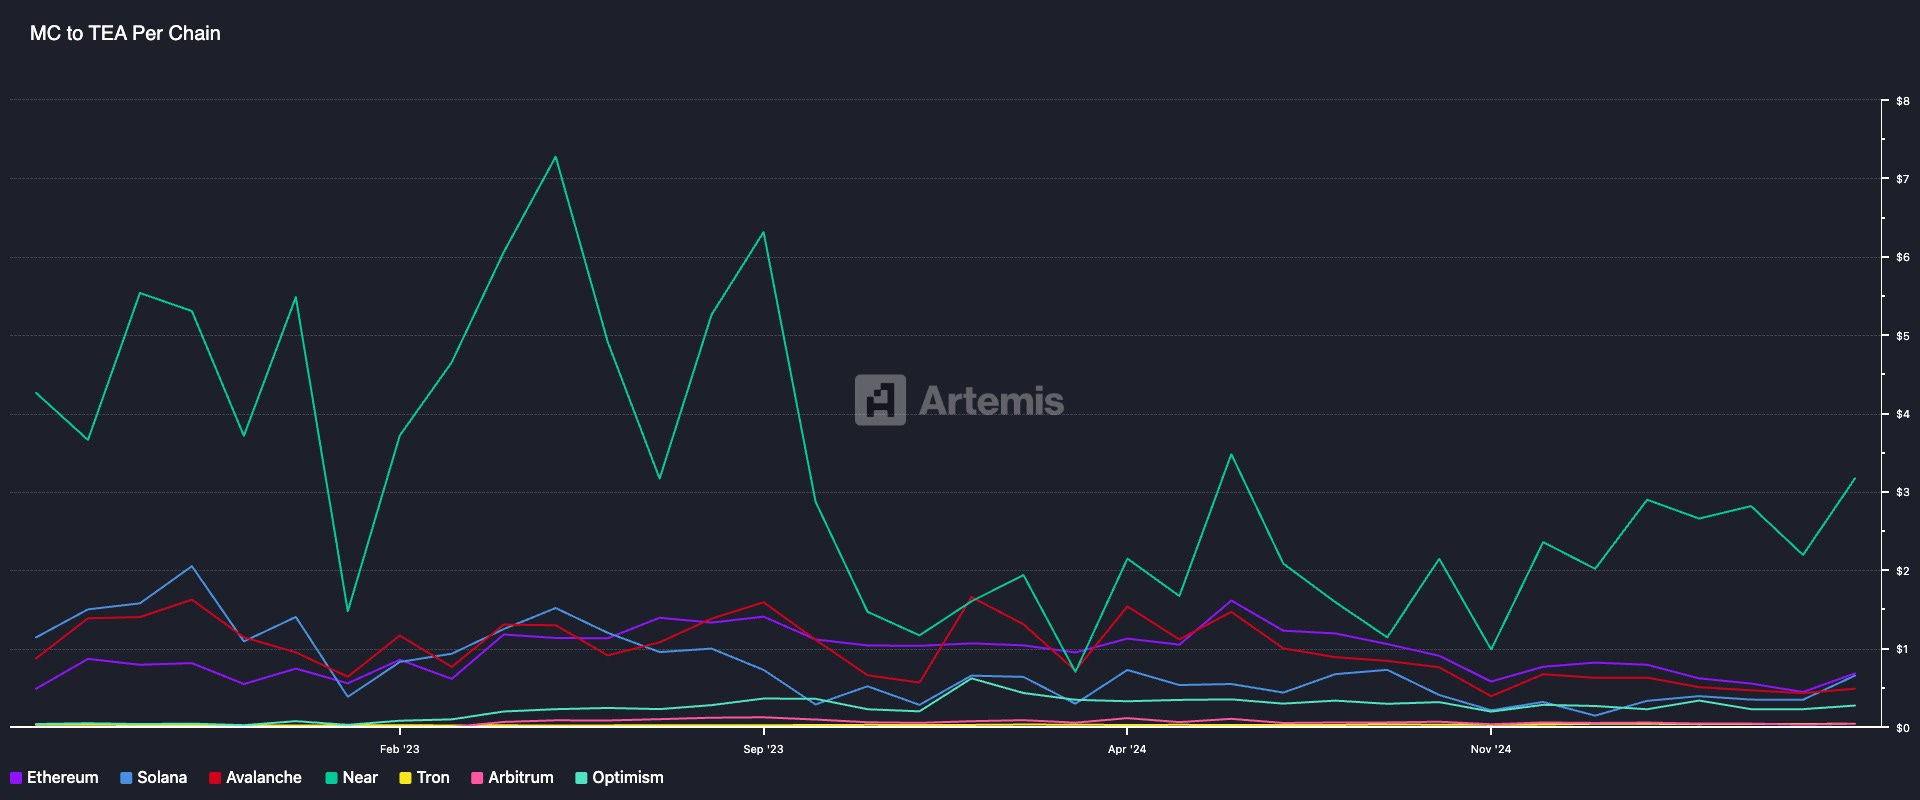
Above we can see each chain’s Market Cap relative to its TEA. A low ratio indicates high levels of economic activity relative to market cap and can signify undervaluation. Vice versa, a high ratio indicates lower levels of economic activity relative to market cap and may signify overvaluation. Note how Near appears overvalued relative to the level of economic activity occurring in its ecosystem, whereas chains like Tron and Solana have healthier valuations comparatively.
There is also a strong relationship between TEA and Market Cap, particularly on lower granularity timeframes. This relationship is consistent and persists during the distinct periods where REV missed the mark as a metric, such as Solana during 2021 and Ethereum post-2022:
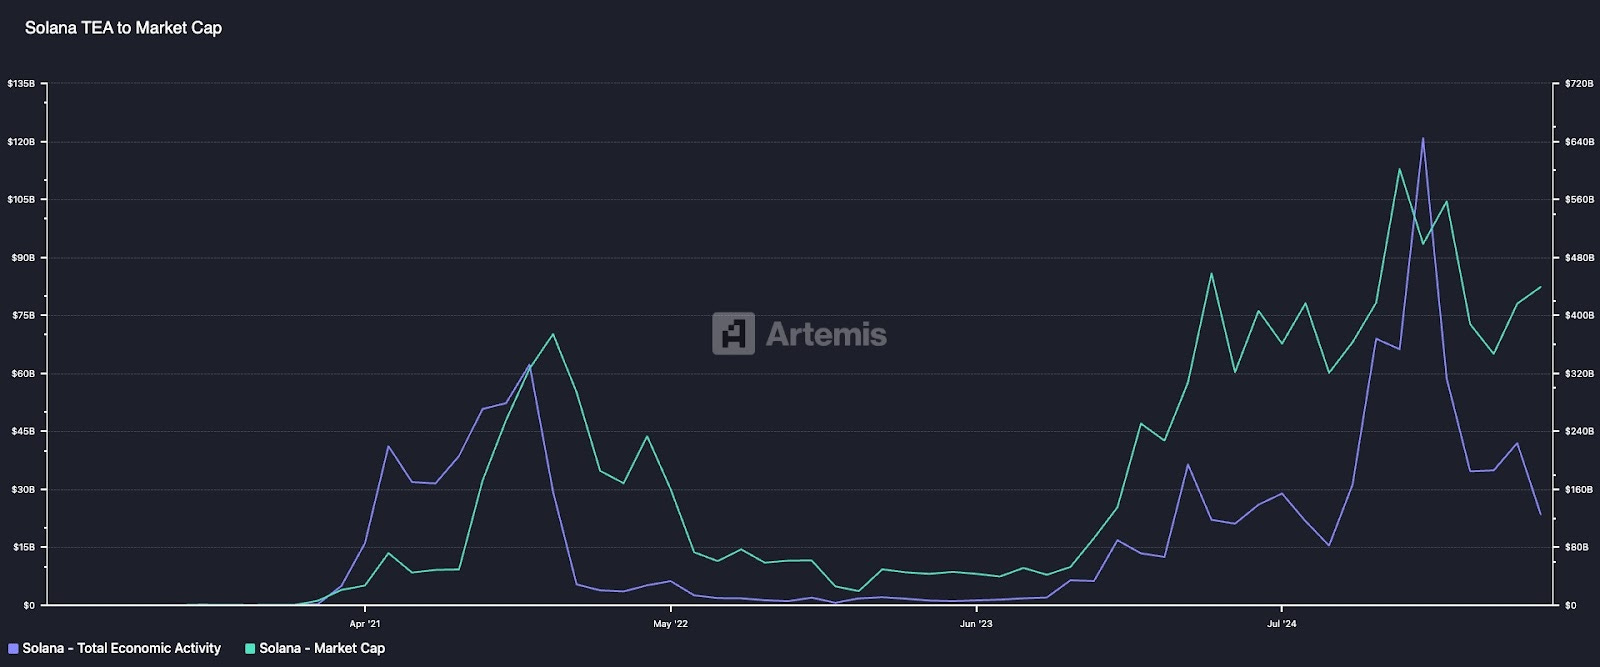
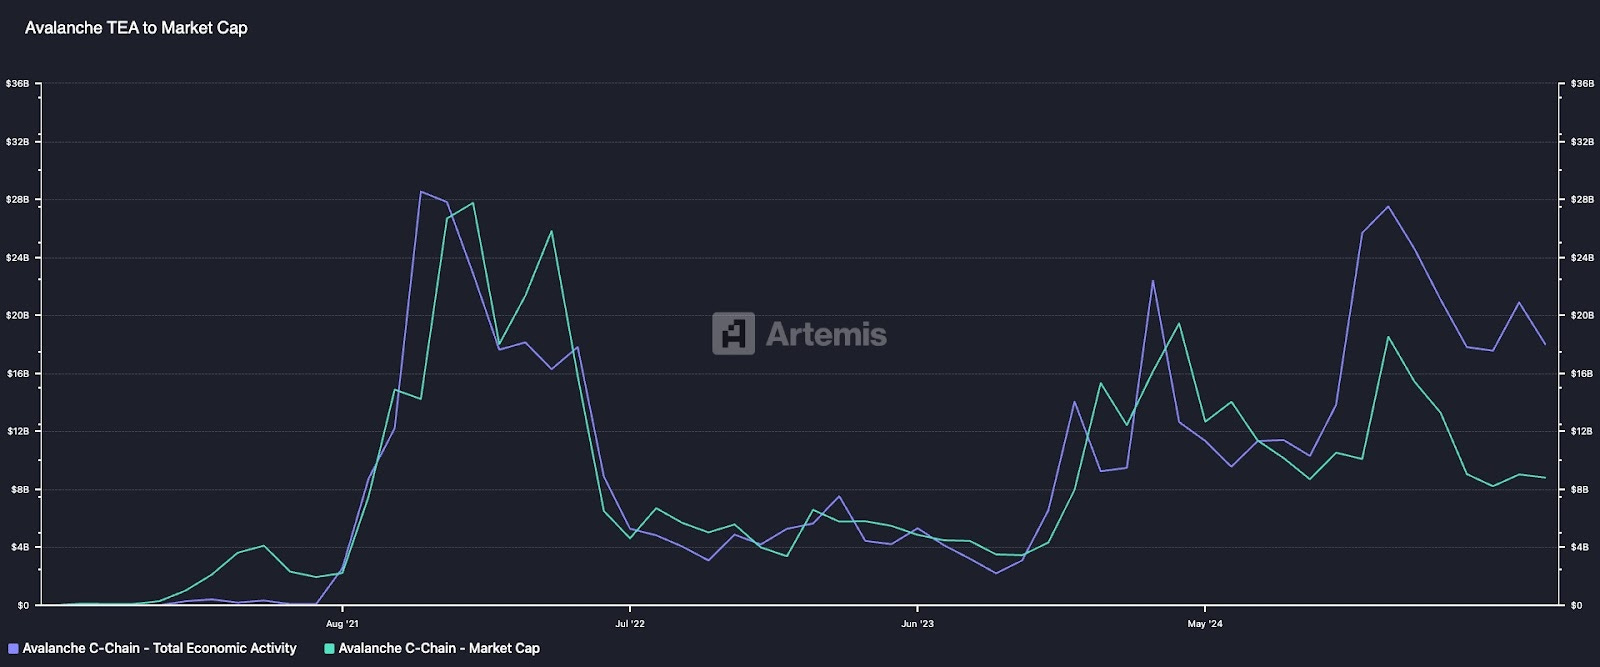
Over the last 24 months we see roughly 0.76 correlation on Solana and 0.80 on Avalanche. Interestingly TEA has stronger correlations to market cap than other popular valuation metrics such as REV over this same period at 0.61 and 0.62 respectively.
While correlation does not equal causation, there appears to be a fundamental long run relationship between TEA and Market Cap. In our opinion the existence of this long run relationship implies that blockchains are in part valued based on their function as a settlement layer, and the economic activity they are able to securely facilitate. This seems obvious conceptually, as higher levels of activity signifies a more robust, vibrant, and valuable economy. As economic activity on-chain increases via asset transfers, swaps, NFT sales, etc., this creates inherent demand for the native asset (as users must pay gas fees in the native asset) which impacts price.
This has a few important implications. First, the rollup-centric roadmap is definitely bearish for the L1. L1’s cede valuable economic activity to rollups, losing all benefit of retaining these users and their on-chain activity. While L1’s do collect blob fees, these fees are negligible relative to the rest of the economic activity captured by the L2.
Second, foundations and blockchains should optimize for value-bearing transactions. Having a robust and liquid DeFi ecosystem should be a priority and a pre-requisite for a productive digital economy. Providing an environment conducive to P2P, remittance-based use cases is also crucial.
Third, given the relationship between Market Cap and TEA, as more and more value begins transacting on-chain (property rights, IP rights, etc.) there will be multitudes more value captured by blockchains. This has extremely bullish ramifications for the leading blockchains that capture this economic activity, assuming this relationship holds.
Potential Shortcomings
Despite the effectiveness of TEA, there are some caveats.
The metric components for established chains are dominated by Settlement Volume. Again, this includes DEX Volumes, NFT Volumes, and P2P Transfer Volume. The other components can make up a larger share of the metric for different chains with different use cases and patterns of activity, but for most established blockchains Settlement Volume makes up the majority of TEA.
The second caveat worth noting is that while there is a strong relationship and correlation between Market Cap and TEA, part of this can be due to price sensitivity to the native asset for native components such as P2P Native Transfer Volumes. The majority of P2P transfer volume is non-native however. Part of this relationship can also be due to the short term dynamics of change in price leading to change in on-chain activity. For example, as native token price increases, levels of speculation on-chain (and therefore volumes) will increase subsequently as well. This is the case for many other metrics as well however, and not a unique constraint of TEA. Price often reacts to exogenous events quicker than fundamentals.
Conclusion
To summarize, Total Economic Activity (TEA) is a comprehensive new metric for valuing blockchain economies by measuring all forms of on-chain economic activity, including chain fees, settlement volume (DEX trades, NFT sales, P2P transfers), and application fees. Unlike traditional GDP or existing metrics like REV, TEA treats blockchains as complete economies rather than mere products or value accrual mechanisms for stakers. Our research demonstrates a long run relationship, strong correlations between TEA and market capitalization across major chains like Ethereum, Solana, and Avalanche, and a ratio to market cap making it useful for comparative analysis and identifying undervalued blockchains. It is our opinion that TEA provides the best framework for measuring economic activity across a variety of blockchains, ranging from specialized remittance based chains to general-purpose platforms like Ethereum.
For any questions, comments or feedback we’d love to hear from you! Institutional investors, give us your take. If you’re a chain that has not been included, we’d love to chat to see how we can partner up to add TEA for your chain. If you’re a protocol feel free to reach out too. We are constantly adding coverage for protocol fees so as our coverage expands so will this metric.
 | A guest post by
|