
Artemis Crypto Factor Model Analysis: March 2026 Update
An update on how beta, size, value, and momentum systematically drove crypto returns.

Data as of: March 5, 2025
Source: Artemis
Executive Summary
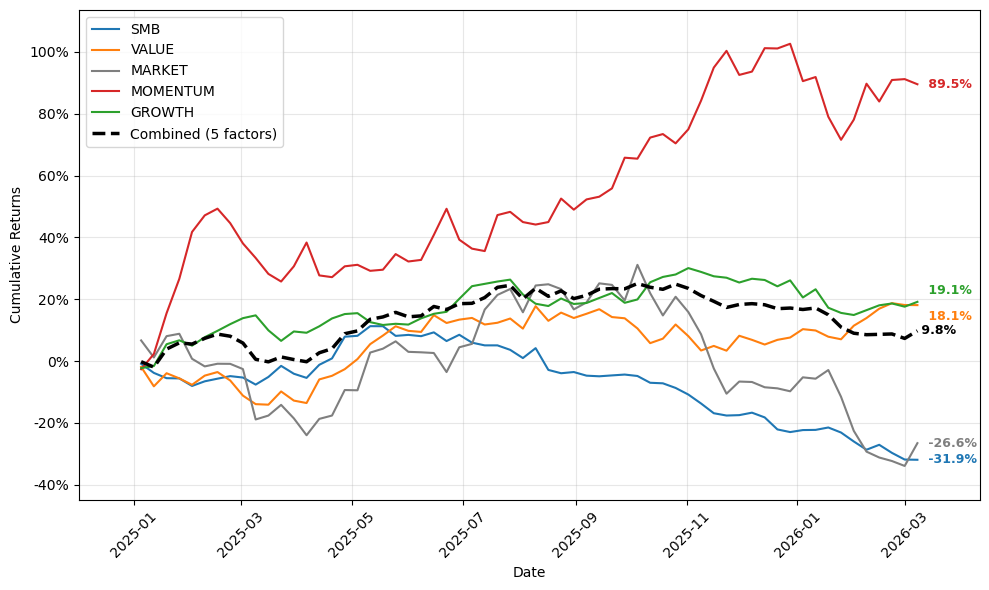
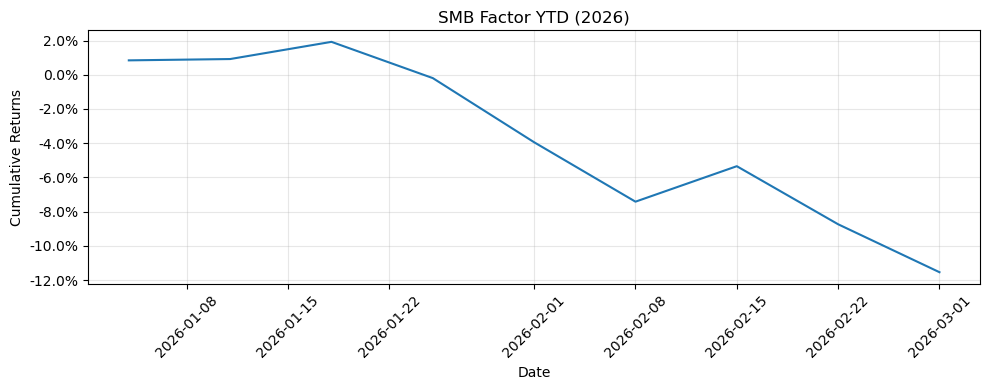
Crypto markets experienced a significant drawdown in February, with the broad market factor down -23.49% for the month and -18.60% YTD, driven by weakening sentiment, macro headwinds, and institutional rotation away from token speculation.
Despite this, three of five factors delivered positive February returns: Momentum (+11.27%), Value (+10.91%), and Growth (+2.65%). This demonstrates the core benefit of long-short factor construction in navigating bear markets.
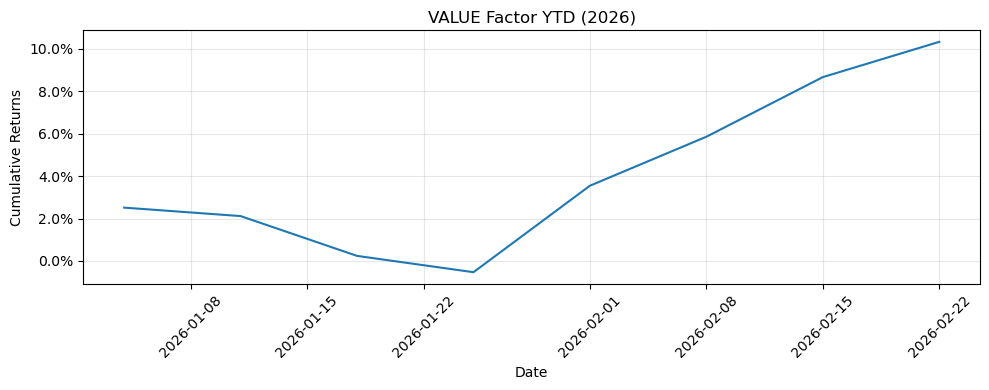
Value had the most contained drawdown from ATH of any factor (-7.33%), benefiting from naturally risk-off environments where speculative assets in the short leg sell off disproportionately.
Momentum delivered a strong monthly return (+11.27%) despite a falling market, confirming the durability of the volatility-adjusted relative strength signal.
Growth showed the lowest volatility of all five factors (22.36%) annualized and remained positive in February, validating the composite fee growth and DAU signal as a resilient fundamental indicator.
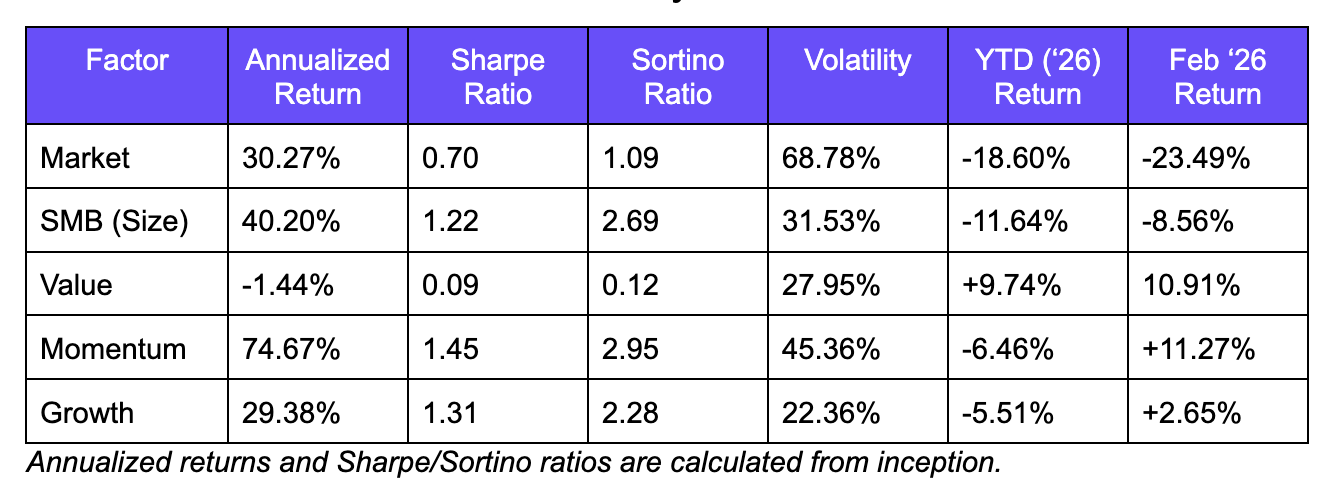
Size (SMB) was the most affected long-short factor (-8.56% in February), consistent with patterns where liquidity-driven selloffs hit smaller assets hardest, though its long-run annualized return of 40.20% and Sortino of 2.69 confirm the premium is still intact.
L2 tokens, particularly ARB and OP, and large-cap DeFi names like APT, EIGEN, and ENA consistently appeared as short winners across SMB, Value, and Momentum. This reflected broad weakness in those categories. On the long side, HNT and Morpho were the most consistent outperformers, appearing as long winners in Value and either SMB or Momentum.
Context: November 2025 Findings
In our original factor model analysis published November 2025 (here), we found:
The five systematic factors (Market, Size, Value, Momentum, and Growth) collectively explained ~55% of individual token returns and ~75% of diversified portfolio returns.
Market risk explained the majority of returns with Size being the strongest standalone factor of the time (53% annualized).
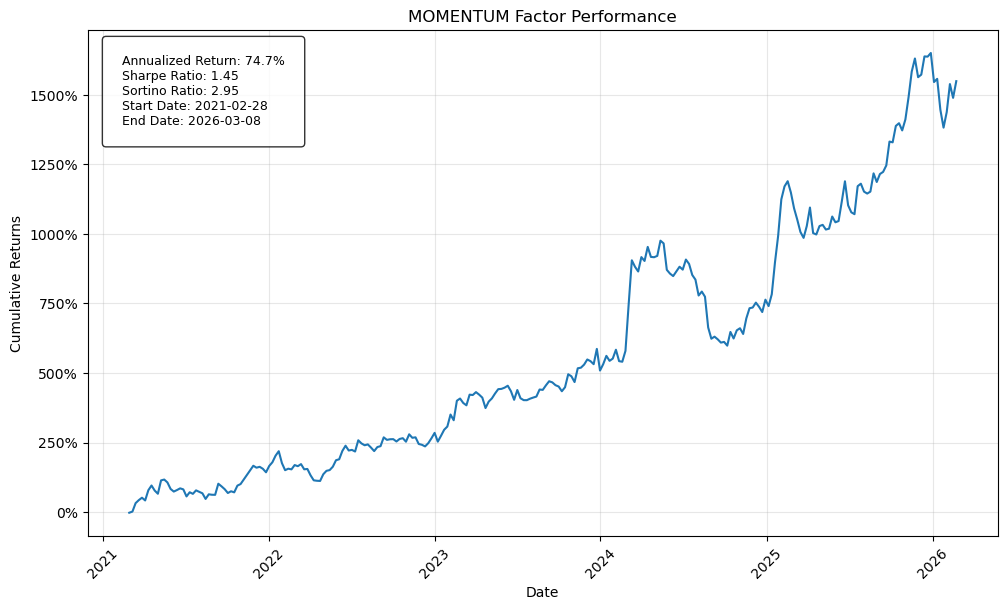
Momentum generated the highest raw returns (75% annualized) but had the lowest explanatory power, suggesting it is better used as a trading signal than a systematic risk factor.
Value was positive but weak, and factor correlations were low across the board, confirming each factor captures a meaningfully different dimension of risk.
This March 2026 update is the first refresh since that publication. The four months since November have been the most challenging in the dataset for long-only crypto exposure, making it a meaningful stress test of the framework and one that the long-short factor strategies largely passed.
Market Context
As of March 4, 2026, the entire crypto market has experienced a strong pullback, with YTD market factor returns at -18% and major assets down roughly 25% or more YTD following a weak 2025. This is driven by declining market confidence in major crypto assets, lowered expectations (Polymarket has BTC hitting $100K in 2026 at just a 43% chance), and macroeconomic pressures triggering a sell-off in risk assets. Additionally, while spot ETFs brought adoption, institutions are increasingly focused on digital asset equities and stablecoin infrastructure rather than token speculation.
Despite this slump, the multi-factor framework demonstrates its value in environments like this. Three of the five factors delivered positive returns in February despite the market factor falling -23.49%: Value (+10.92%), Momentum (+11.27%), and Growth (+2.65%). The long-short construction allows these strategies to generate returns independent of broad market direction, capturing relative performance between assets rather than relying on the market going up.
Five-Factor Performance Summary
Market Risk Factor
Construction
Long-only portfolio of the top 10 assets by market cap, market cap-weighted, rebalanced weekly. Captures broad crypto market exposure similar to a crypto index.
Current Holdings
BTC (71.8%), ETH (12.8%), BNB (4.6%), XRP (4.5%), SOL (2.6%), TRX (1.5%), DOGE (0.9%), ADA (0.6%), BCH (0.5%), HYPE (0.4%)
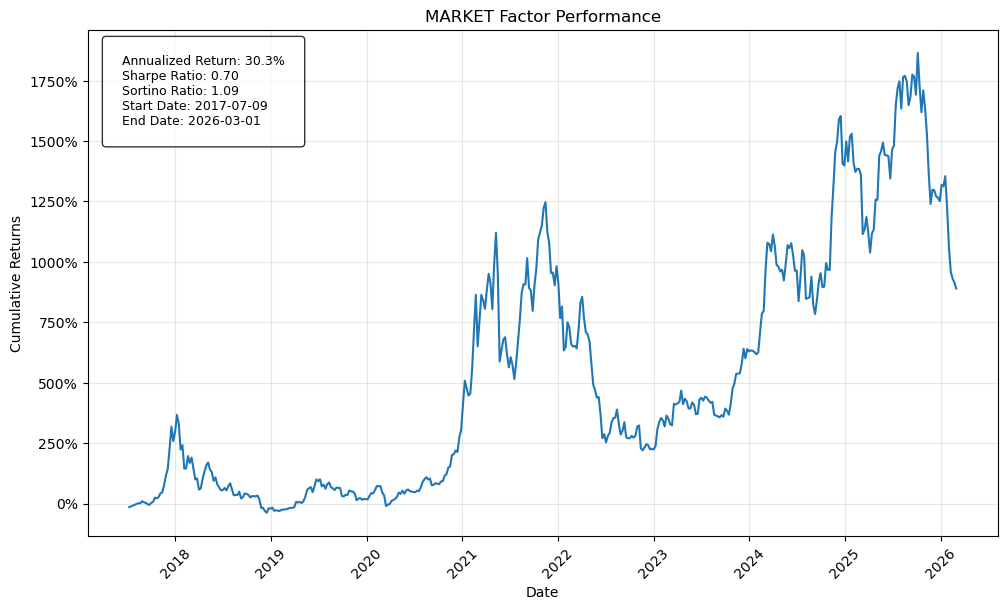
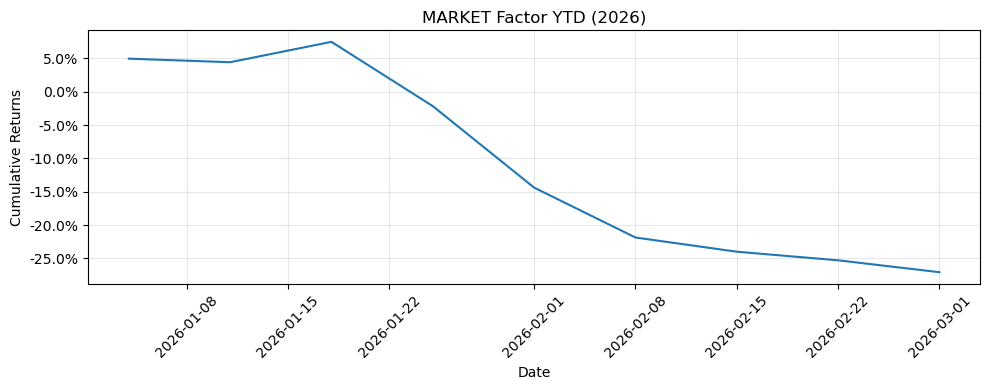
Performance Metrics
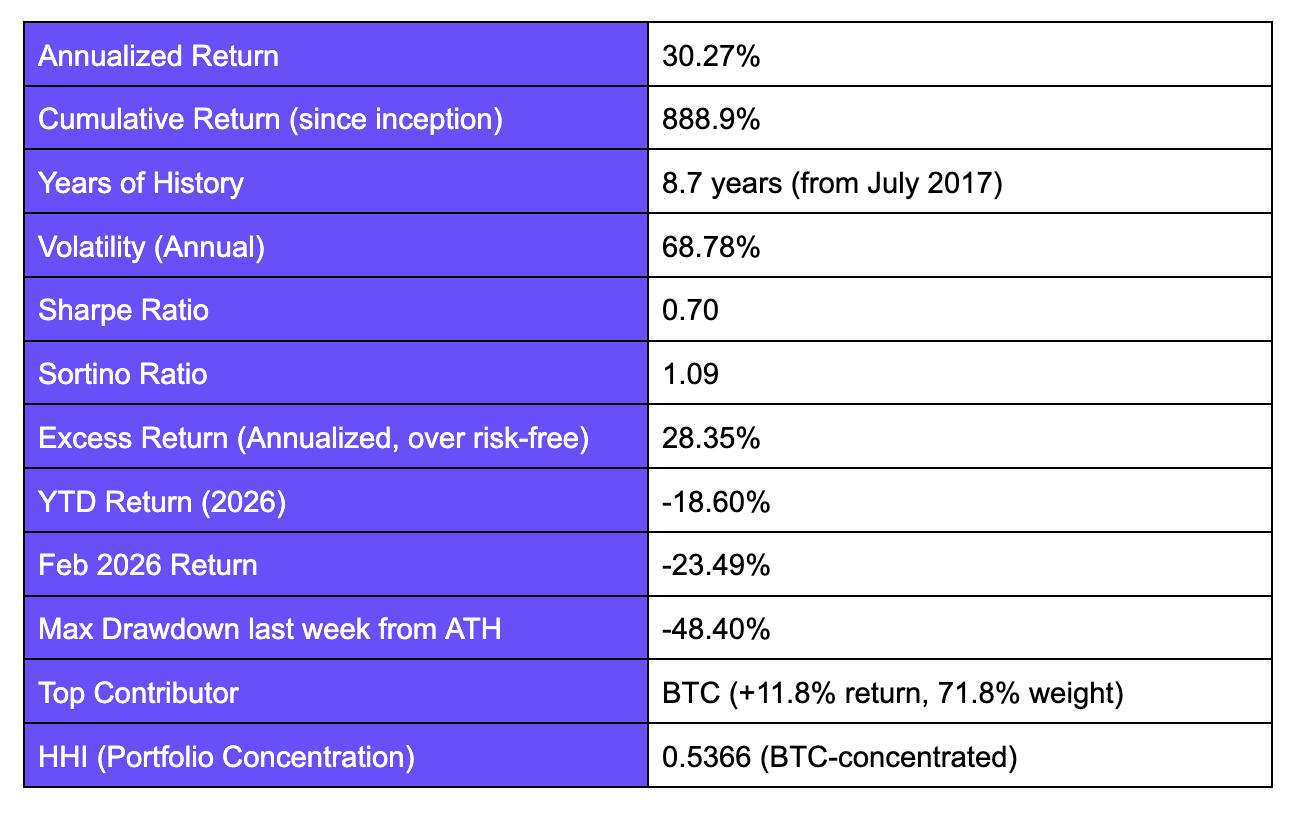
February was a brutal month for broad market factors, down -23.49%. This is one of the sharpest single-month drawdowns in the dataset, bringing the max drawdown from all-time high to -48.40%.
Top 5 Winners & Losers for February
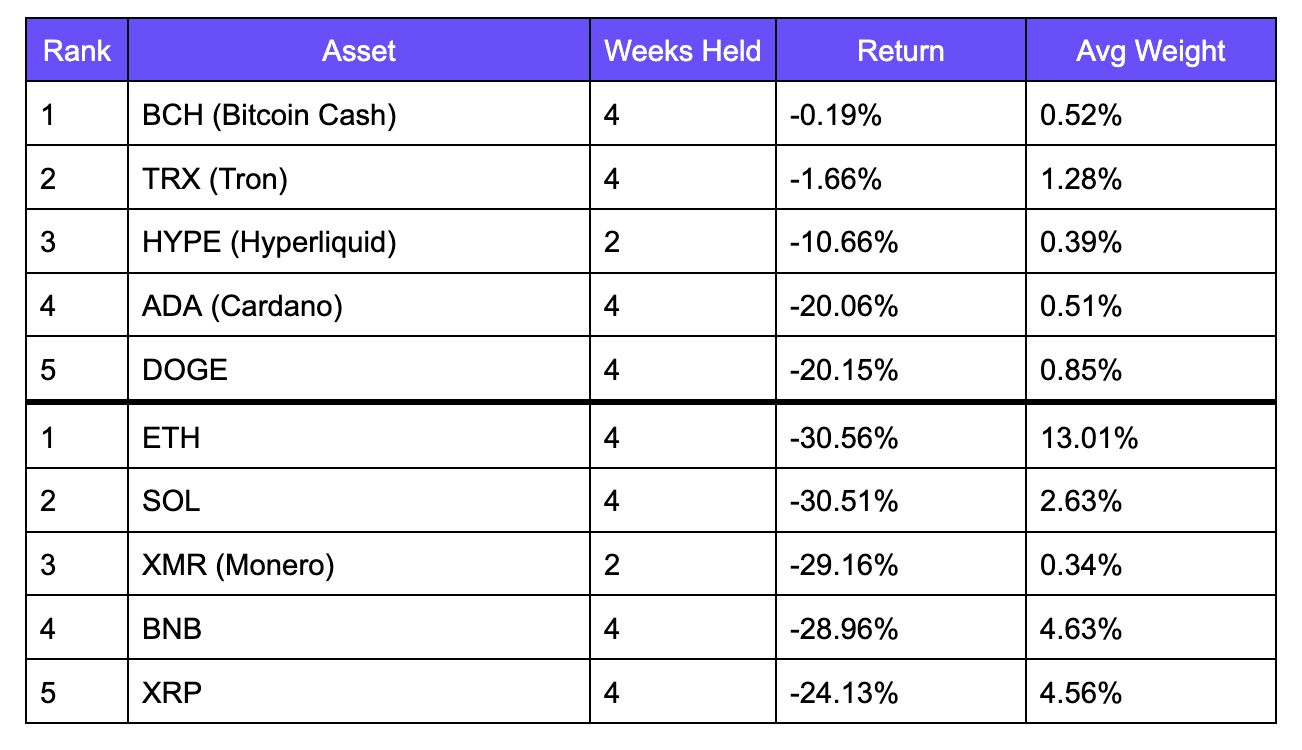
Every asset in the portfolio was negative. BCH (-0.19%) and TRX (-1.66%) were simply the least affected. This is because BCH (Bitcoin Cash) was able to maintain relatively stable trading patterns despite broader crypto market volatility and TRX (Tron) capitalized off the stablecoin narrative as a primary rail for Tether’s USDT. Notably, 4 of the 5 largest holdings were in the top 5 losers of the month, with ETH (-30.56%) leading followed by SOL (-30.51%), BNB (-28.96%), and XRP (-24.13%). BTC, the main asset in this portfolio, also didn’t make the top 5 winners. This is unusual as BTC usually leads relative outperformance in drawdowns due to its safe-haven status within crypto. February’s drawdowns were severe enough that the largest and most liquid assets underperformed on a relative basis, likely reflecting unwinding of leveraged BTC positions and ETF outflows putting pressure on the largest and most liquid assets.
Size Factor
Construction
Equal-weighted long-short factor: long the smallest 50% of eligible assets by market cap, short the largest 50%. Minimum 40 assets (20 per leg). Breakpoint: 50th percentile of market cap.
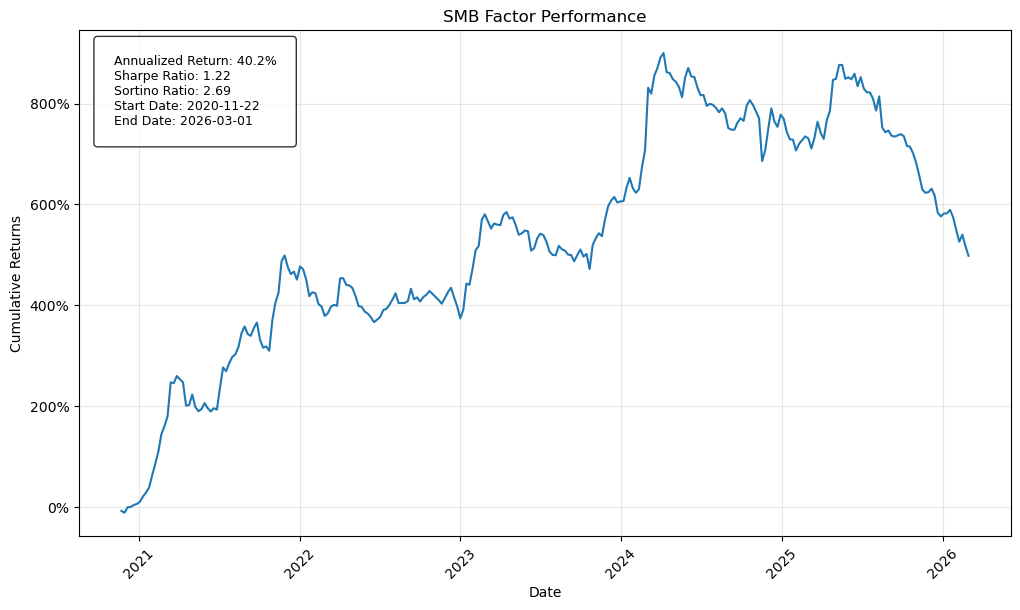
Performance Metrics
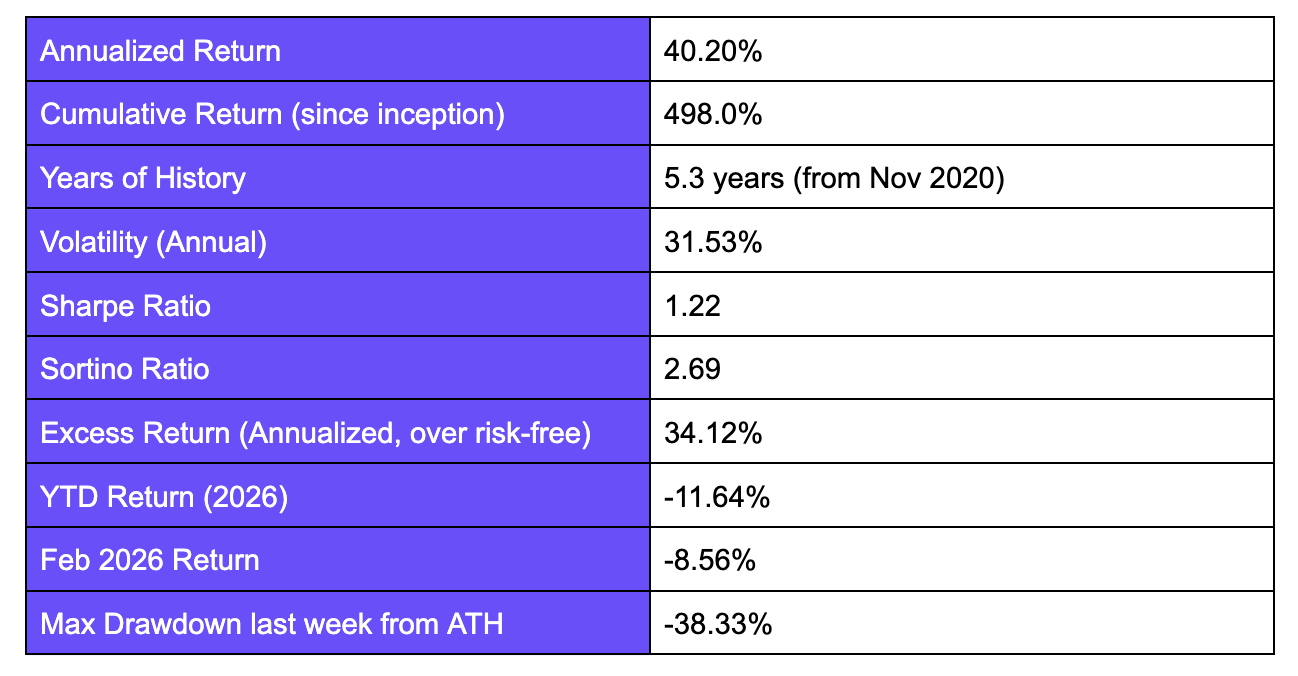
SMB held up better than the market in February but still declined -8.56%. In the risk-off environment, the long-short construction provides some insulation as the short leg (large caps) also falls, partially offsetting losses on the long leg (small caps). However, small caps still underperformed large caps in February, which is consistent with historical patterns where liquidity-driven selloffs disproportionately hurt smaller assets.
Top 5 Winners & Losers for February
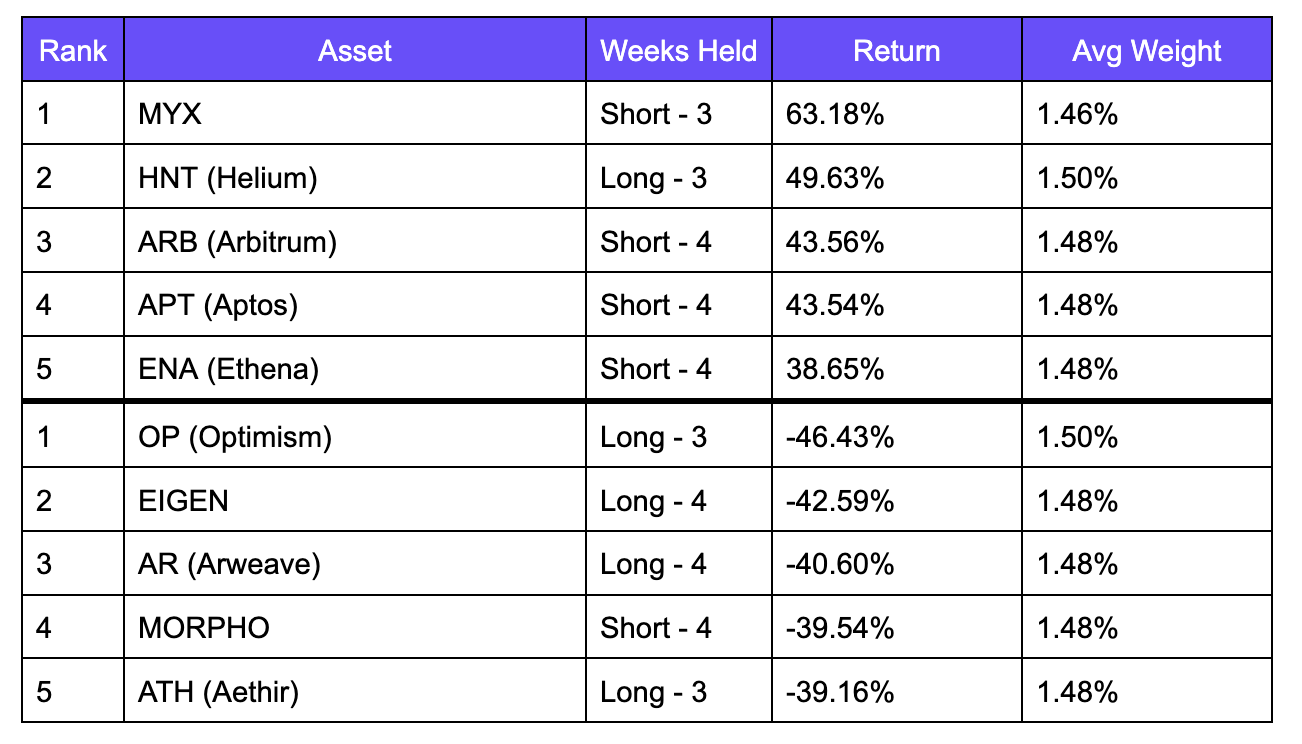
The top winner was MYX Finance (+63.18% as a short), a large-cap DEX that fell sharply, generating strong P&L for the short leg. HNT was the standout long at +49.63%, benefiting from growing demand for its decentralized wireless network that turned into higher fees collected and broader DePIN narrative momentum. Additionally, Helium made a critical decision at the end of January to stop buybacks and instead use the revenue towards subscriber growth, network expansion, and hardware development. ARB, APT, and ENA all contributed as short winners, reflecting broad weakness in the large-cap L2 and DeFi tokens. On the losing side, OP (-46.43% as a long) was the biggest detractor. Although OP is usually considered mid-to-large cap, it may have migrated to the small-cap long after a steady and sharp decline since October 2025. This decline was further fueled by Base’s decision to transition off of Optimism’s tech stack in favor of their own in mid February. Morpho appearing as a short loser (-39.54%) is also notable. It was a strong performer in February, so being short due to its classification as large-cap hurt the factor.
Value Factor
Construction
Equal-weighted long-short: long assets with the lowest Market Cap / Fees ratio (highest fundamental value), short assets with the highest MC / Fees ratio (most expensive). Minimum 30 assets (15 per leg).
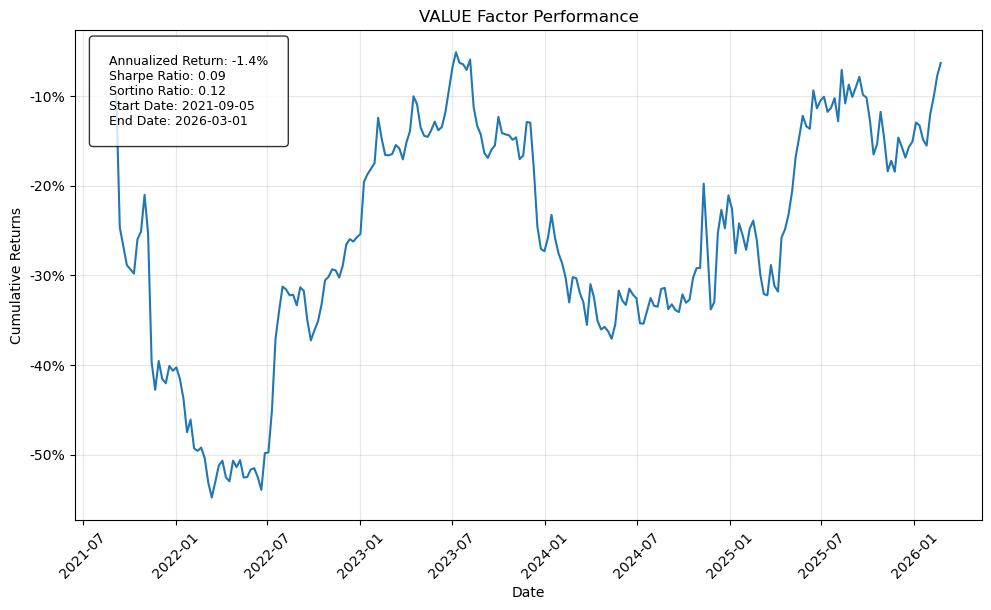
Performance Metrics
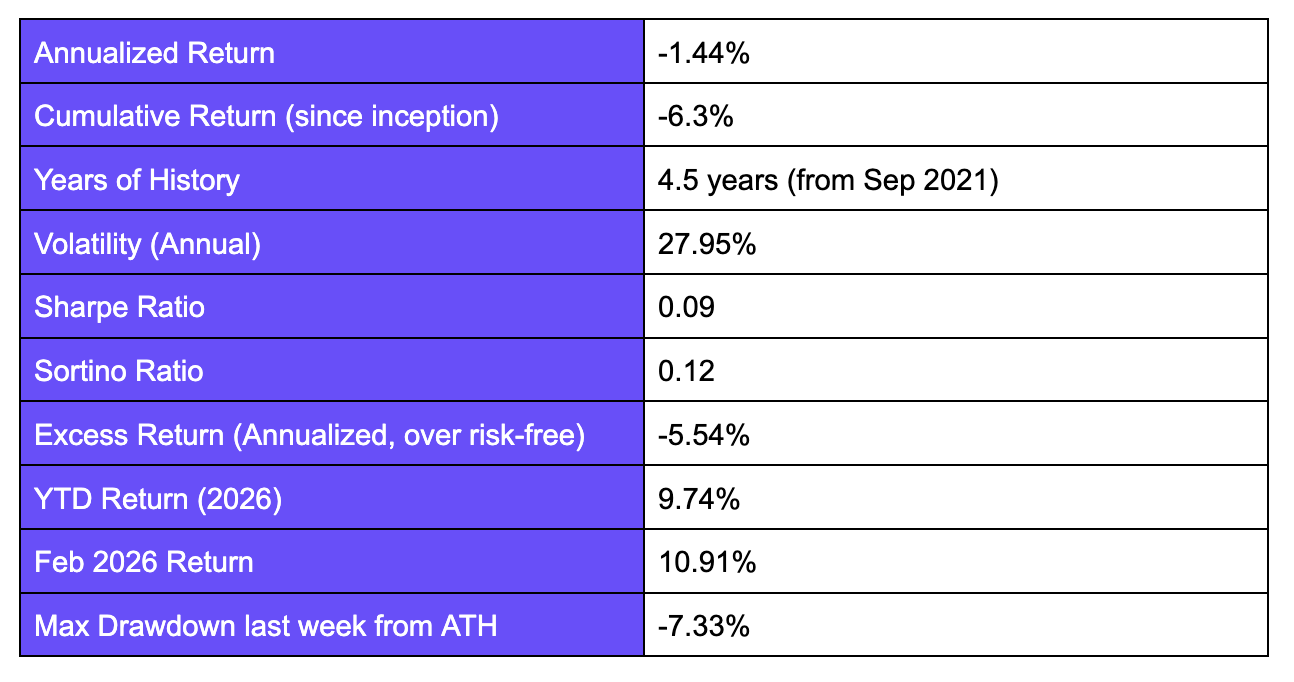
Value was the standout performer in February, delivering +10.91%. Its long-short construction directly benefits in risk-off environments: speculative, expensive assets tend to sell off, while fundamentally cheap assets with strong fee generation hold up better.
Top 5 Winners & Losers for February
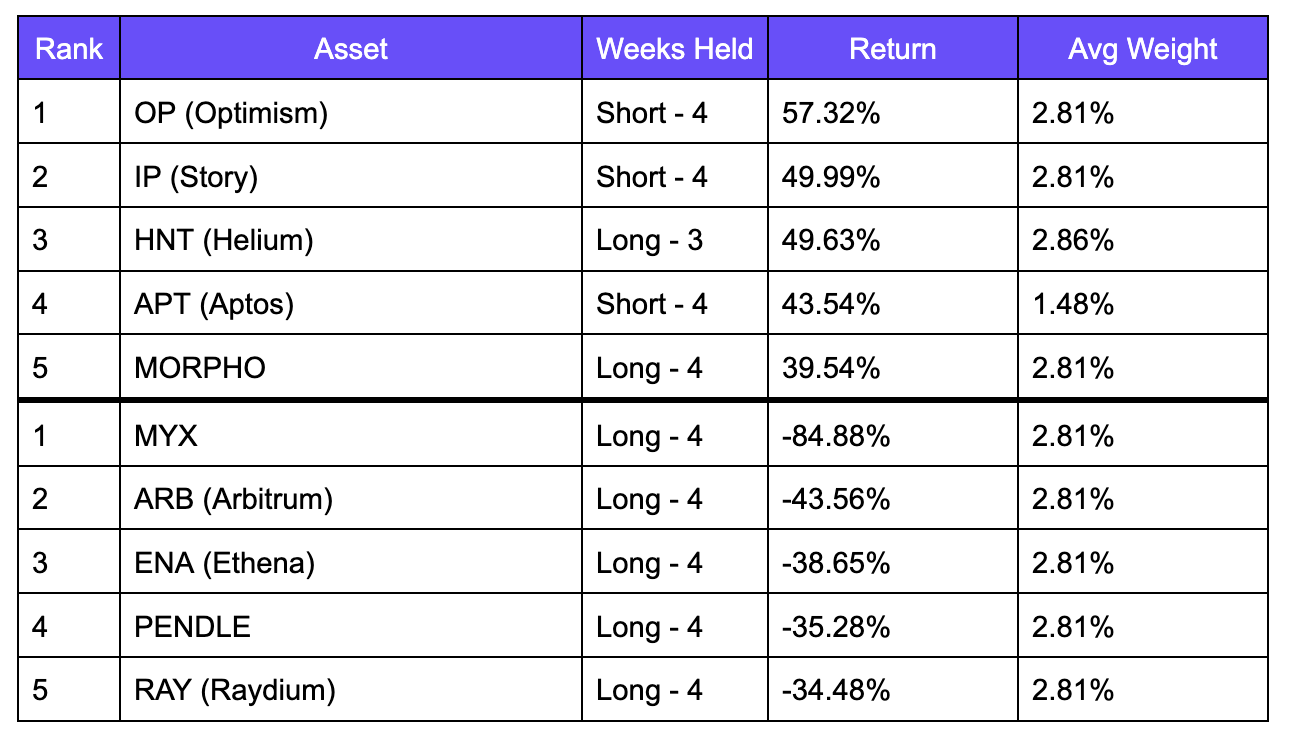
OP (+57.32% as a short) and IP (+49.99% as a short) were the top contributors. Both appeared expensive on the Market Cap / Fees ratio and both fell hard in February. HNT (+49.63%) and Morpho (+39.54%) again feature as long winners, confirming their fundamental cheapness. Morpho’s strong performance reflects its position as a lean, high-efficiency lending protocol capturing market share from larger DeFi incumbents with a higher fee generation relative to size. The biggest loser was MYX (-84.88% as a long) after it was pushed to new 3-month lows and sellers drove momentum. This is more caused by sentiment driving heavy sell pressure as TVL declined less than 10% of total locked value, suggesting that users haven’t mass excited and core utility remains intact. This shows how assets risk significant cheapening due to sentiment and momentum despite strong fundamentals.
Momentum Factor
Construction
Volatility-adjusted momentum: calculates 3-week rolling Sharpe-like score (mean return / std dev of daily return) for each asset. Long top 25% by filtered momentum, short bottom 25%. Equal-weighted, minimum 30 assets (15 per leg).
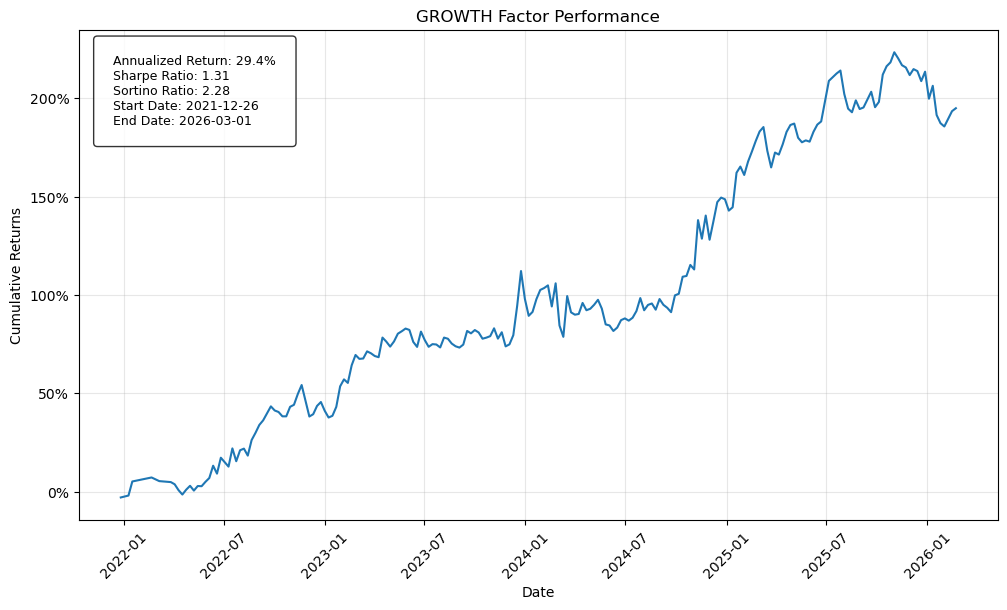
Performance Metrics
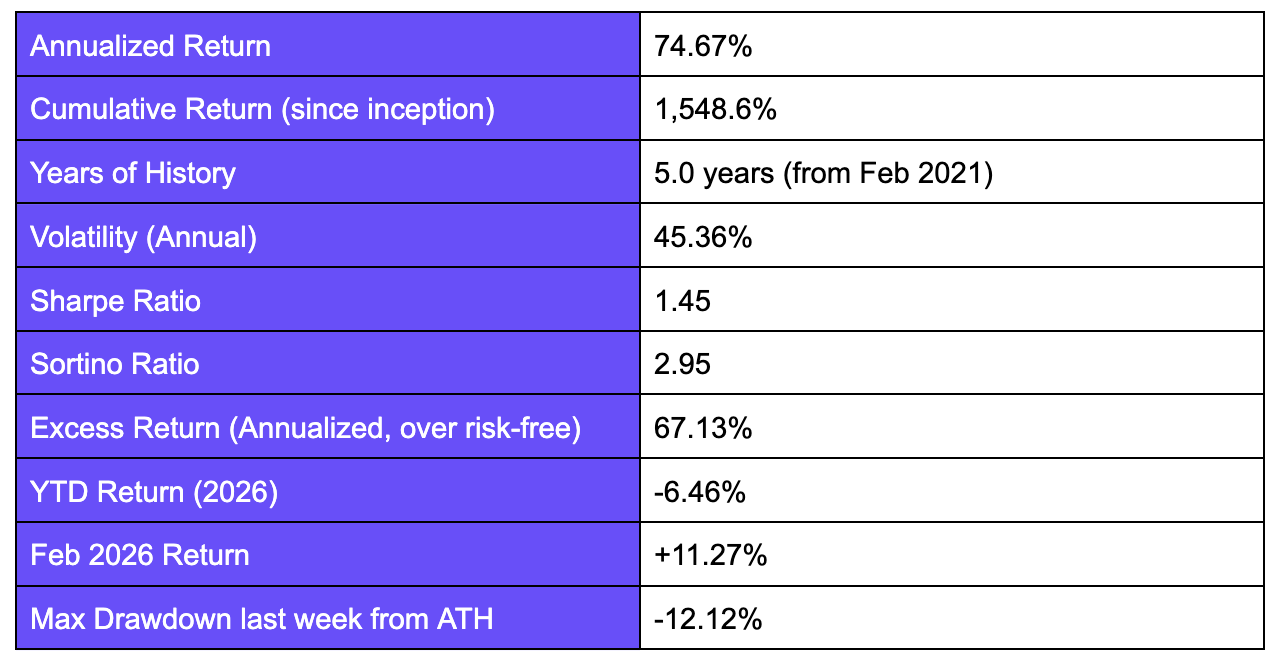
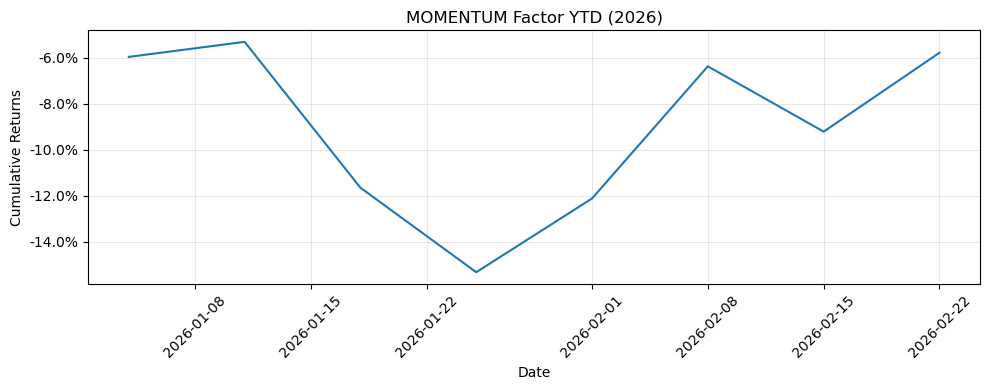
Momentum delivered +11.27% in February, reflecting strong signal performance in trending environments. The max drawdown from ATH of -12.12% is also relatively contained compared to the market and other factors.
Top 5 Winners & Losers for February
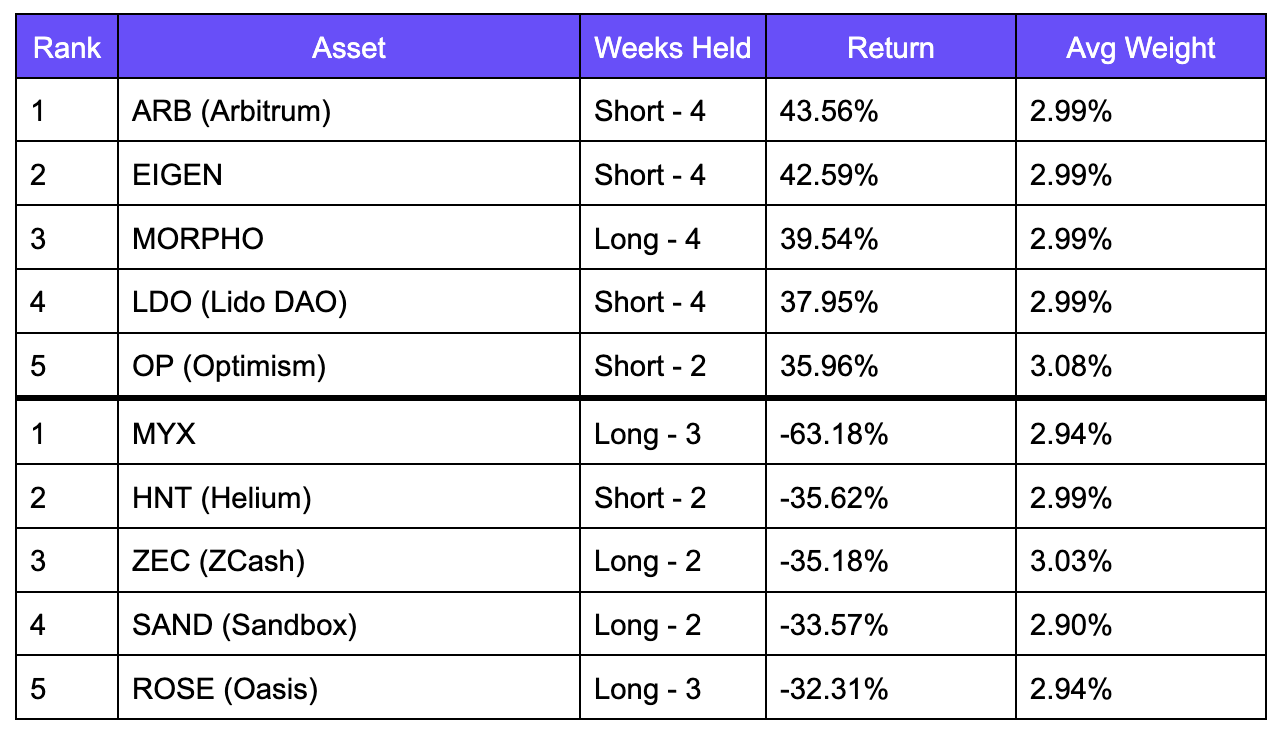
The strong performance in Momentum was driven primarily by the short leg capturing broad weakness in large-cap L2 and governance tokens. ARB (+43.56% short), EIGEN (+42.59% short), LDO (+37.95% short), and OP (+35.96% short) all fell sharply. Morpho (+39.54% long) was the standout long winner, confirming the signal picked up its consistent upward trend. The biggest losers were MYX (-63.18% as a long), which had a strong prior momentum signal that reversed sharply due to sentiment and steep sell offs, and HNT (-35.62% as a short), which the factor had incorrectly classified as low-momentum in some weeks before its February rally. ZEC, SAND, and ROSE also detracted as long positions that trended lower throughout the month.
Growth
Construction
Equal-weighted long-short: composite score combining z-scores of 2-week trailing fee growth (pct change) and DAU growth (pct change). Long top 50% composite score, short bottom 50%. Eligibility requires DAU > 100 and weekly fees > $500. 30 assets (15 per leg).
Performance Metrics
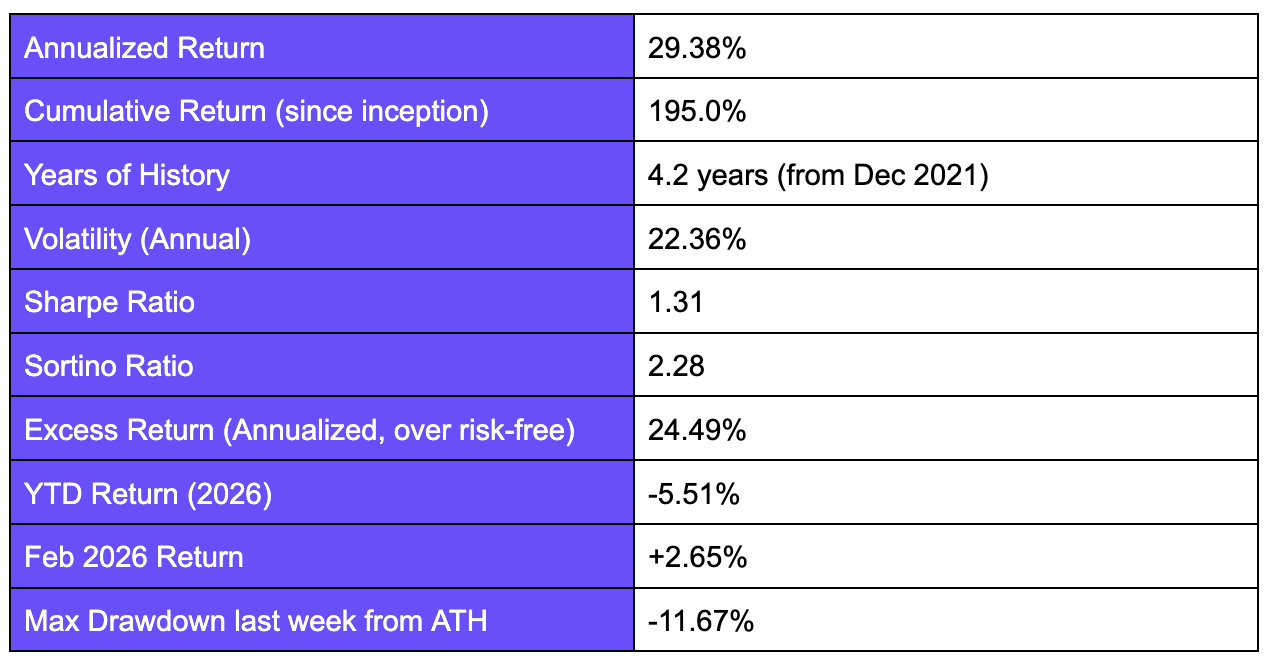
Growth delivered +2.56% in February. Its low volatility (22.36% annualized) is the lowest of all factors. Its focus on fundamentals through identifying accelerating fee and DAU growth provided insulation from the broad sell off. The max drawdown from ATH of -11.67% is the second lowest after Value.
Top 5 Winners & Losers for February
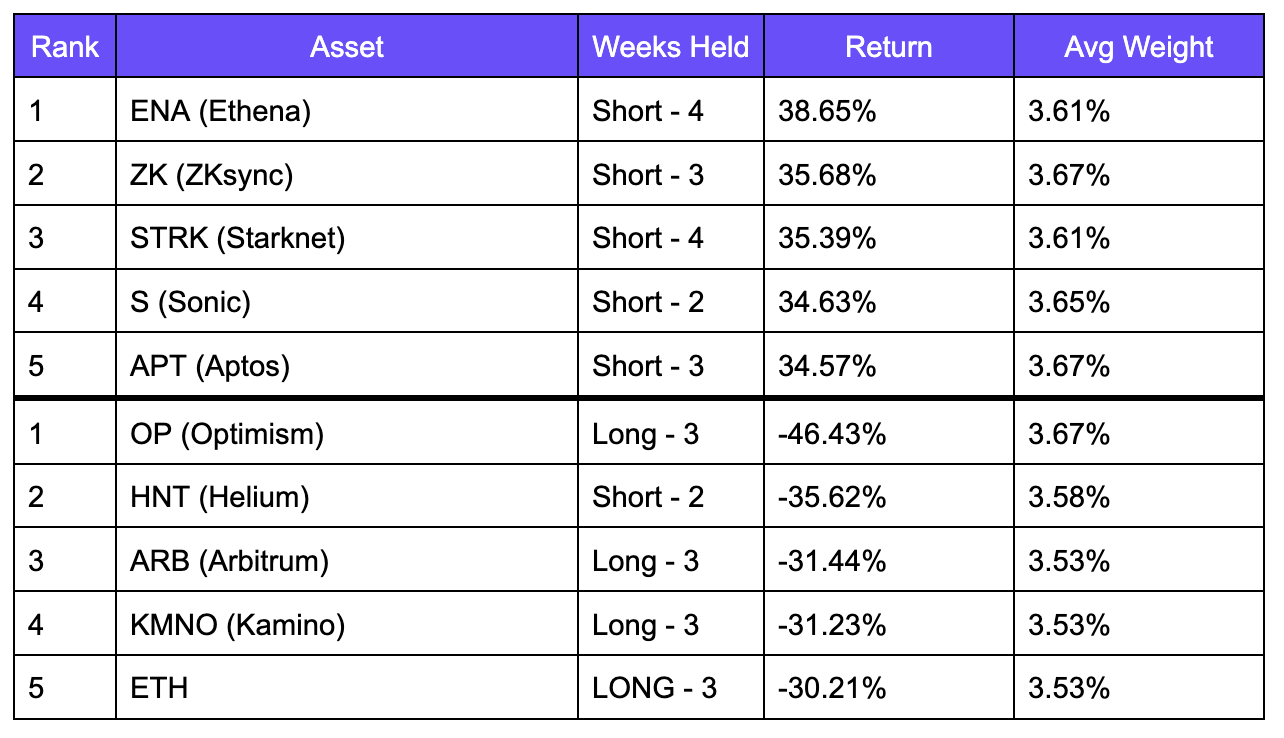
ENA (-38.65%), ZK (-35.68%), STRK (-34.62%), and APT (-34.57%) were all short winners. These were assets that were assessed to have weak or declining fee and DAU growth, and which all fell significantly in February. This validates the composite growth signal’s ability to identify fundamentally deteriorating assets. The biggest loser was OP (-46.43% as a long), which screened as having strong growth metrics but declined sharply due to negative sentiment surrounding the future of the protocol. HNT appeared as a short loser (-35.62%), showing a similar dynamic as seen in Momentum. ARB and KMNO as long losers suggests that some assets with positive growth signals still saw significant price declines in the broad February selloff.
Key Findings & Conclusion
February was a difficult month across the board, with the market factor down -23.5%, one of the sharpest single-month drawdowns in the dataset. Even so, three of the five factors delivered positive returns: Value (+10.91%), Momentum (+11.27%), and Growth (+2.65%).
Value was the most defensively positioned factor, with the lowest max drawdown from ATH (-7.33%) and strong February performance. Momentum showed that even in a down market, relative trend persistence generates alpha. Growth demonstrated that fundamental usage metrics provide a durable signal even when prices are falling more broadly.
A few themes emerged consistently across factors in February. L2 and governance tokens (ARB, OP, APT, EIGEN, and LDO) appeared repeatedly as short winners across SMB, Value, and Momentum, reflecting sustained and broad weakness in that category throughout the month. This wasn’t noise; these assets were consistently identified as expensive, large-cap, or low-momentum, and their declines generated meaningful P&L across multiple factor short legs simultaneously. On the long side, HNT and Morpho appeared as winners in Value and Momentum, confirming that their outperformance was fundamentally driven rather than a single-factor artifact. MYX was the most damaging single position across factors, appearing as a short winner in SMB (+63.18%) but a severe long loser in Value (-84.88%) and Momentum (-63.18%), illustrating how a single asset can simultaneously validate one factor signal and punish another depending on construction.
In a month where simply holding crypto lost you 23%, systematic factor strategies demonstrated they can generate meaningful returns by identifying which assets fall the most and which fall the least.
If you have any questions, feel free to reach out to team@artemis.xyz or shoot us a DM on X
Disclosure: This material is provided for informational purposes only and does not constitute investment advice, financial advice, trading advice, or any other form of advice. The views expressed are those of the authors and should not be relied upon as a recommendation to buy, sell, or hold any asset. The authors or affiliated entities may hold positions in the assets discussed. You should conduct your own research and consult appropriate financial professionals before making any investment decisions.
 | A guest post by
|